Figures & data
Figure 1. Detonation point and stormwater subcatchments potentially affected by air dispersion of radiological contamination (orange dashed area represents the area of highest radiation hazard in hypothetical scenario).
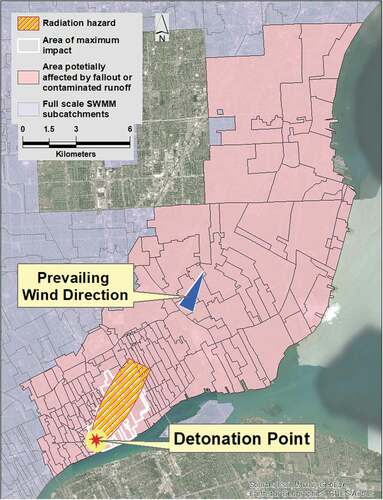
Table 1. Data sources used in developing the case study SWMM model
Figure 2. Contents and steps in overland flow model preparation and execution.
Figure 3. Subarea of the model domain containing finer resolution overland flow mesh. Subcatchment, building, and road layers were used to construct the model.
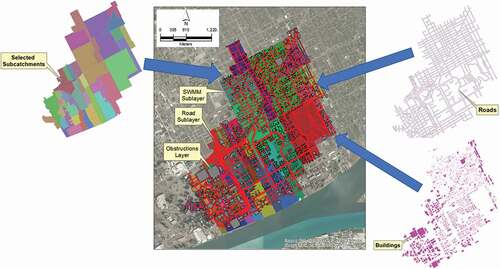
Figure 4. Input data for converting 2D cells to subcatchments included land use type, percentage impervious, slope, and elevation information for the model domain.
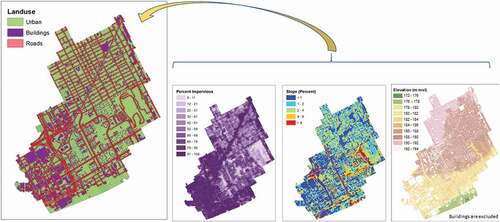
Table 2. Washoff coefficients and exponents used in the case study model representing the statistical summary of the relevant values from Maharjan, Pachel, and Loigu (Citation2017) (used in the maximum/minimum parameter value comparison) and the values assigned to each land use type
Figure 5. Total runoff generated during the 2-year 24-hour MSE Type III storm (total precipitation = 58.7 mm). The subterranean conduit system was not factored into this analysis.
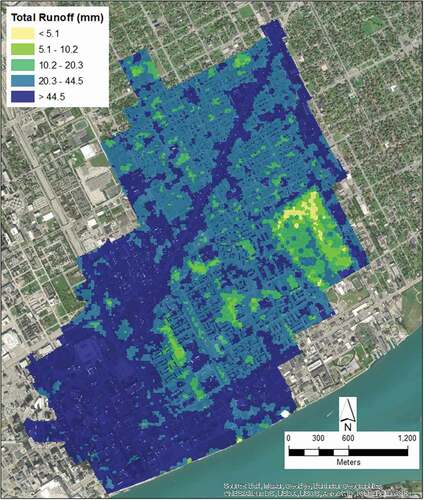
Table 3. Simulation mass balance summary for the washoff studies using the Detroit case study model and the precipitation data from the 27 July 2014 storm
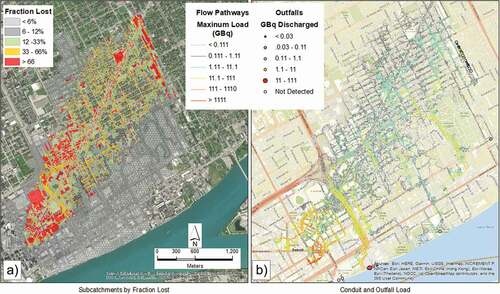
Figure 6. (a) 137Cs washoff and (b) maximum activity in overland flow and cumulative activity discharged at outfalls as a result of the 1-hour 2-year peak intensity storm that occurred on 27 July 2014.
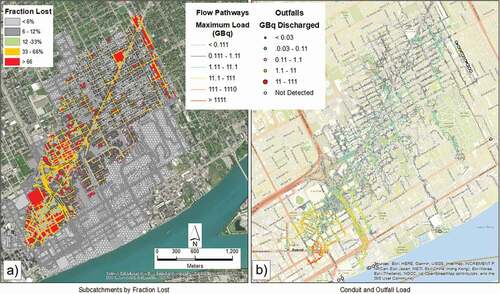
Figure 7. (a) 137Cs washoff and (b) maximum activity in overland flow and cumulative activity discharged at outfalls as a result of the 2-year, 24-hour MSE type III design storm.