
Figures & data
Figure 1. The methodology flow chart.
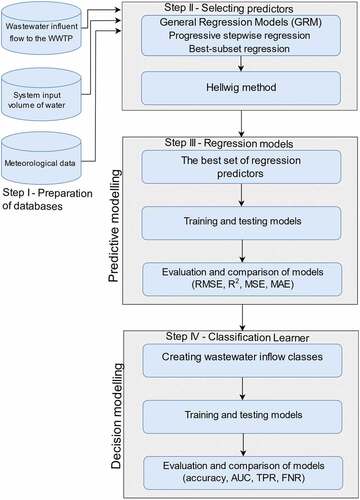
Figure 2. Pareto charts for (a) all variables (b) the best-subset regression based on R2 (c) the best-subset regression based on Mallows’ CP (d) progressive stepwise regression.
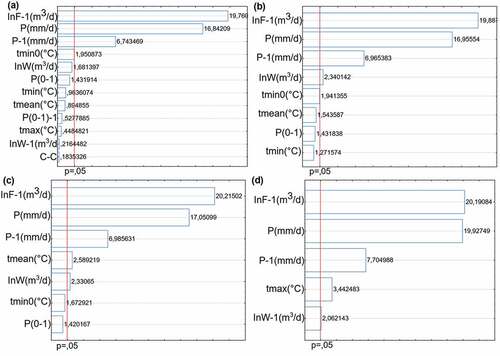
Table 1. Results of the selection of Hellwig method predictors.
Figure 3. Proposals of considered predictor sets for building regression models.
Table 2. Quality of influent flow regression models based on selected predictor sets.
Figure 4. True and predicted influent flow to WTTP in each month for Quadratic SVM.
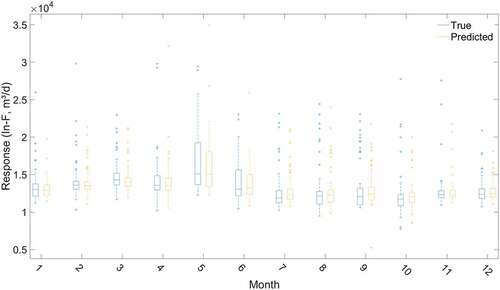
Figure 5. Decision Tree for WTTP.
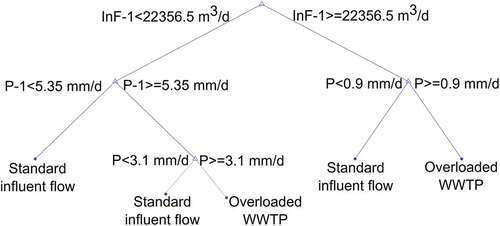
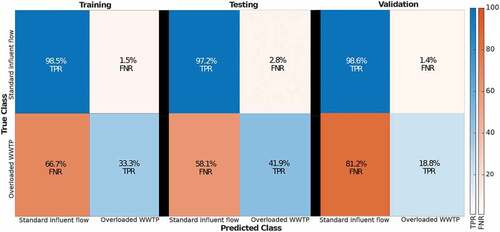
Figure 6. TPR and FNR for training, test and validation sets.
Data availability statement
On analyses in this manuscript, please contact: [email protected]