Figures & data
Figure 1. Experimental set-up for the particle dosing experiment; (a) Schematic drawing of the setup; (b) Details of the rainfall simulator plate viewed from below.
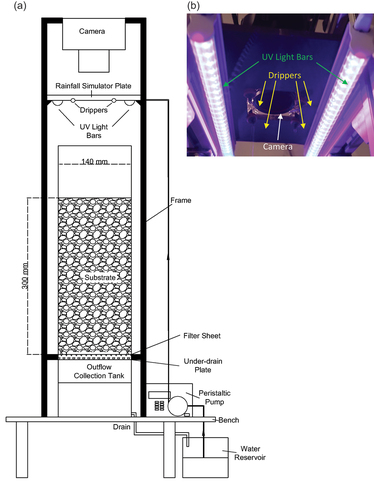
Figure 2. The two growing media used in this study; (a) Bioretention Grey to Green media (G2G); (b) Green roof Marie Curie Substrate (MCS).
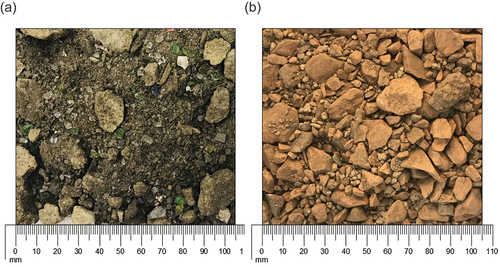
Figure 3. Estimated pore size distribution (derived from measured soil water release curve) for the two growing media (G2G and MCS) and particle size distribution for the fluorescent particles (secondary Y axis).
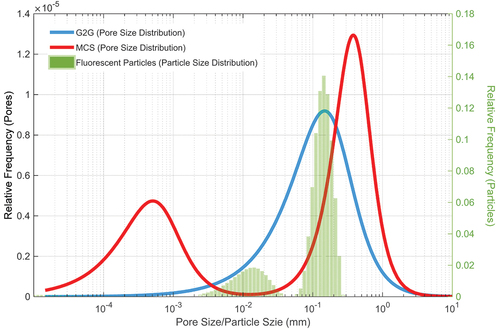
Figure 4. Surface images for G2G and MCS at the end of each particle dosing.
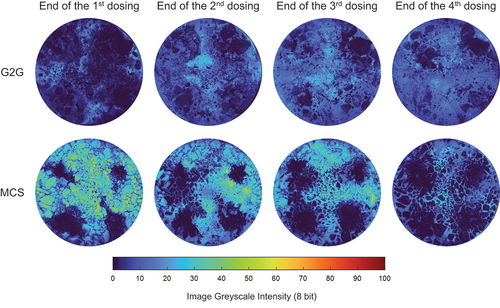
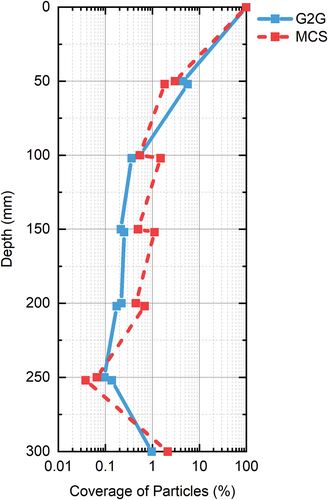
Figure 5. Surface particle coverage for G2G and MCS in the experiment.
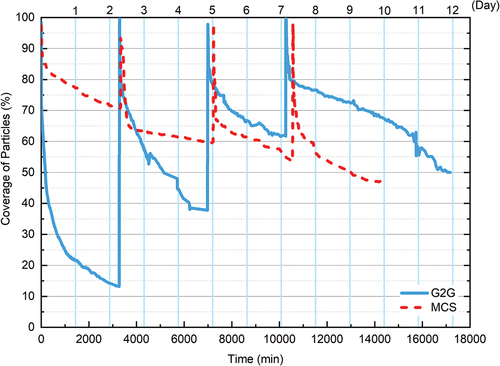
Figure 6. Photographs taken from the side of the columns at the end of the experiment: (a) G2G; (b) MCS.
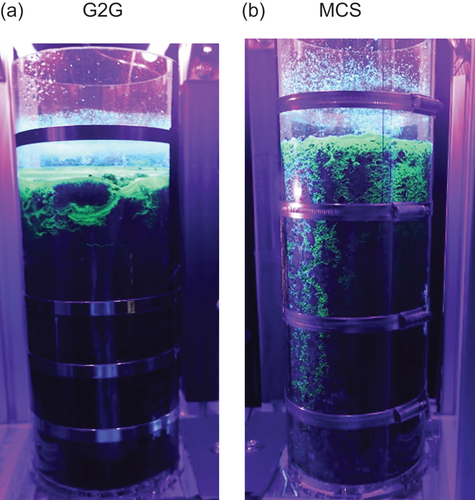
Figure 7. Images for the sliced G2G at the end of the experiment.
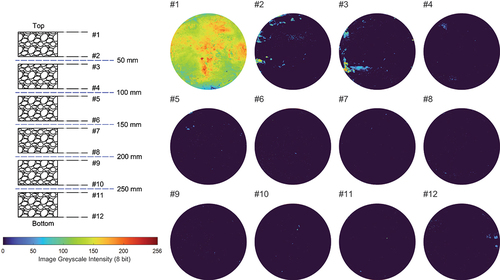
Figure 8. Images for the sliced MCS at the end of the experiment.
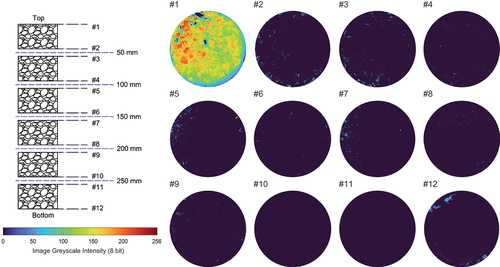
Figure 9. Cross-sectional vertical particle distribution of the tracer for the two growing media derived from the sliced growing media images.