Figures & data
Figure 1. Example of a pipe network descripted in (a) the classic node-arc topology, and (b) segment-valve topology.
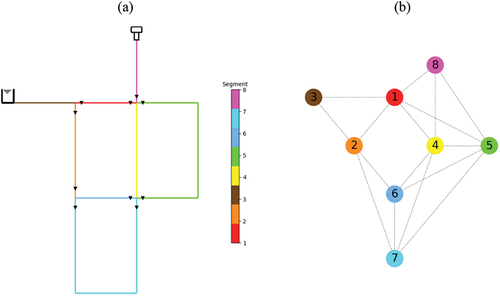
Figure 2. Illustrative example of Tabu Search moves: (a) initial solution; (b) 1st iteration; (c) 2nd iteration; (d) 3rd iteration and (e) 4th iteration.
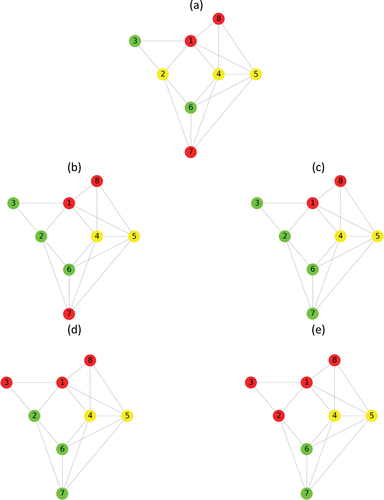
Figure 3. Evolution of IVI and PAC: (a) status quo situation, (b) traditional strategy in which single pipes are rehabilitated that reach their expected service life and (c) novel methodology.
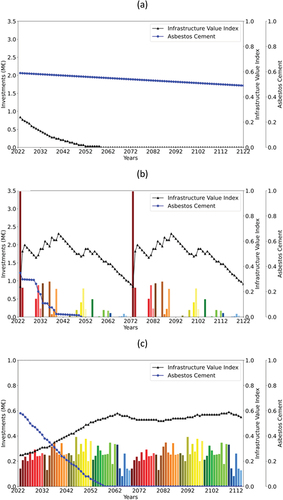
Figure 4. Geospatial representation of the schedule of interventions in rehabilitation units: (a) traditional strategy in which single pipes are rehabilitated that reach their expected service life and (b) novel methodology.
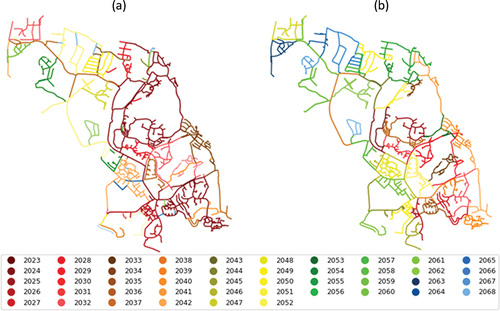
Figure 5. Representation of the distribution network in the segment-valve topology with grouping pipes.
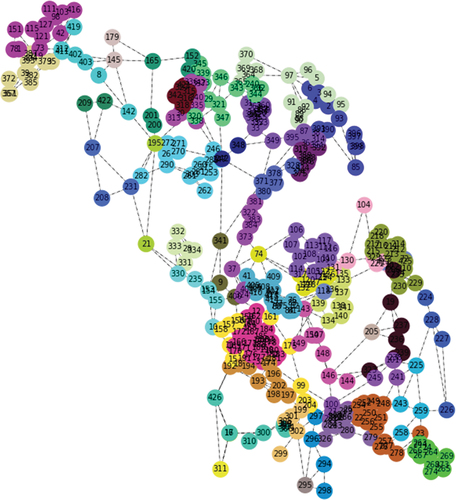
Table 1. Scenarios considered in the sensitivity analysis and obtained results.
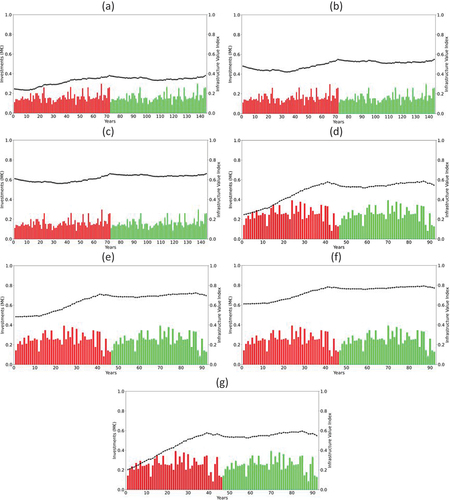
Figure 6. Sensitivity analysis for (a) Scenario A; (b) Scenario B; (c) Scenario C; (d) Scenario D; (e) Scenario E, (f) Scenario F and (g) Scenario G (red bars − 1st investment cycle; green bars − 2nd investment cycle).