
Figures & data
Figure 1. Graphical determination of required storage volume (Smet et al., Citation2002).
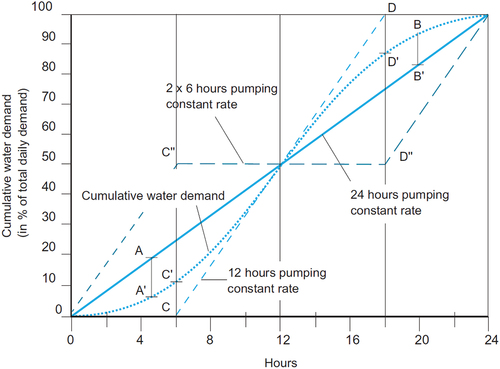
Figure 2. Water storage volume composition (Trifunović Citation2020b).
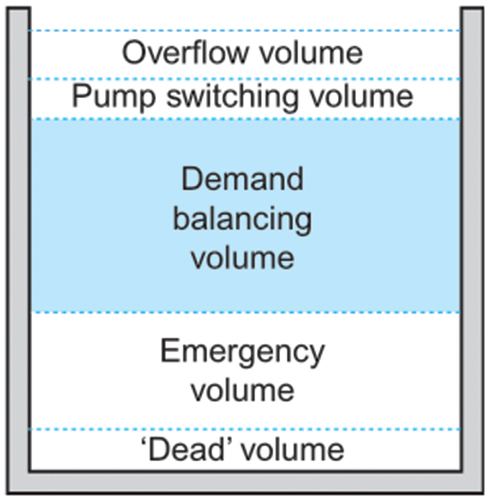
Figure 3. Tank and pump response to 100%, 75% and 50% of network balancing volume.
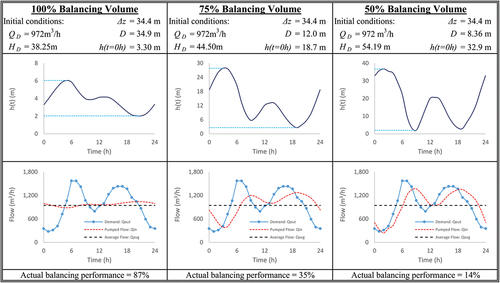
Figure 4. Single-point pump curve for duty head, HD, and duty flow, QD adapted from Rossman, (Citation2000b).
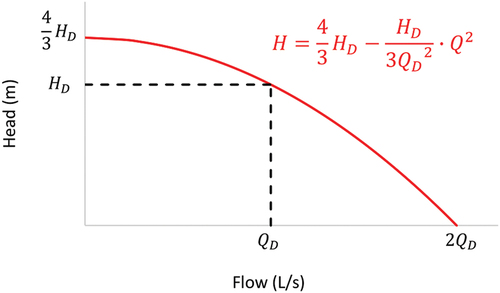
Figure 5. Variable speed setting, N, such that pump operates at average flow, QD.
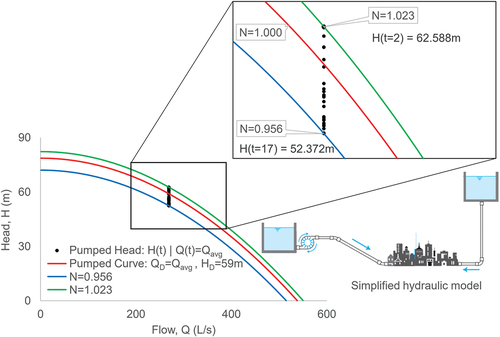
Figure 6. SCOPE flowchart.
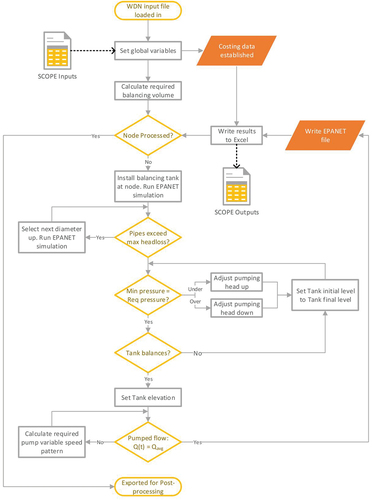
Figure 7. Example balancing tank response to a 4h power outage.
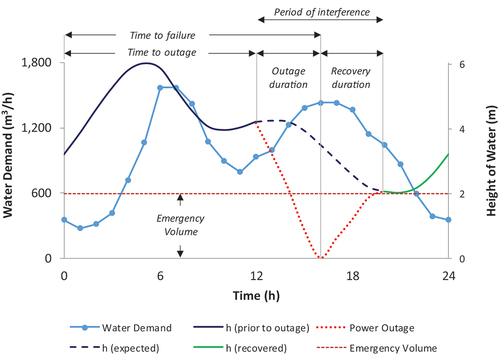
Figure 8. Graphical representation of SCOPE’s step 3 procedure with quasi code.
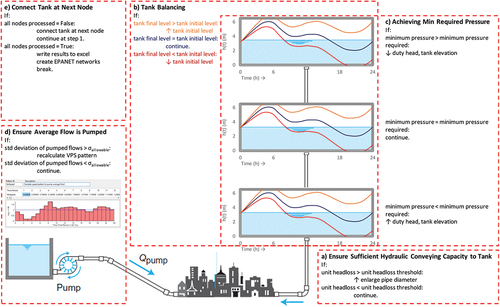
Figure 9. Nametown network layout (most critical node: e05 = 20.08 mwc @ 6:00 AM), adapted from Trifunović (Citation2020b).
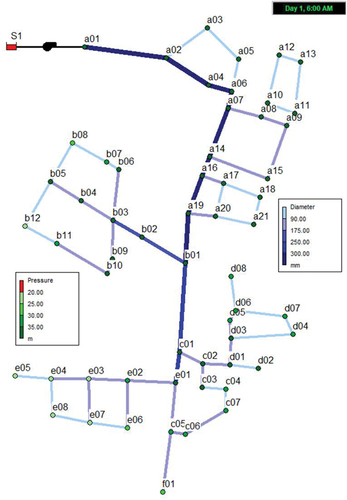
Figure 10. Nametown SCOPE processed results for total annual expenditure and pumping energy consumption for each possible tank location.
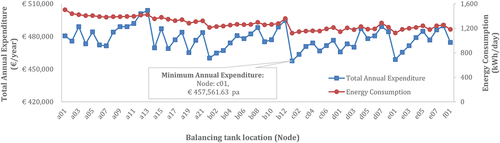
Figure 11. Optimised decision variables where (a) shows the SCOPE determined pump variable speed pattern, (B) shows the SCOPE determined tank position and pipe diameters and (C) shows GA post-processed pipe diameters.
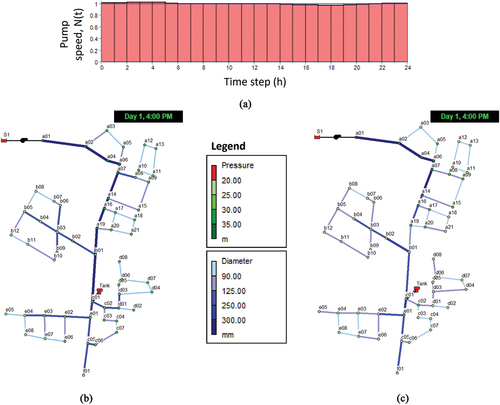
Table 1. Decision variables and resultant financial summary for SCOPE and GA post-processed Nametown network (in EUR).
Table 2. Baseline cost for the proposed Dili WDN (in USD).
Figure 12. Partitioned Dili WDN.
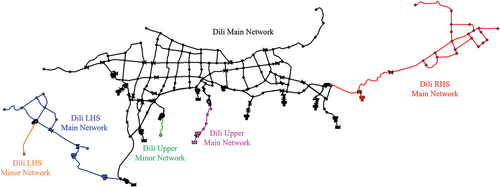
Figure 13. Dili RHS Main network SCOPE results.
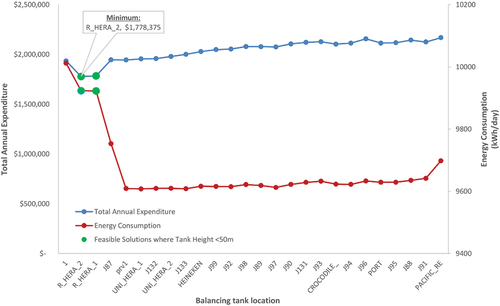
Table 3. Comparison of the original and SCOPE processed parameters for the Hera pumping station.
Figure 14. Dili RHS Main SCOPE + GA post-processed pressure distribution.
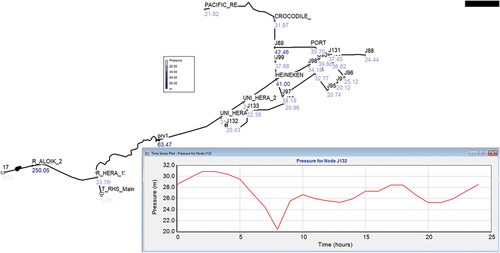
Figure 15. Optimal location of the Dili network’s balancing tanks, as determined by SCOPE.
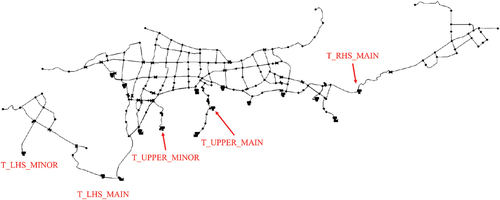
Table 4. SCOPE optimised Dili network financial summary (in USD).
Table 5. GA optimised Dili network financial summary (in USD).
Data availability statement
All data, models and code that support the findings of this study are available from the first author upon reasonable request.