Figures & data
Figure 1. An idealized bridge model with support degradation traversed by a quarter-car vehicle.
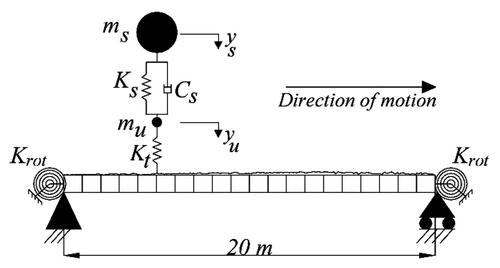
Table 1. Properties of the bridge model.
Table 2. Mechanical properties of the idealized quarter-car adapted from (Keenahan et al., Citation2014).
Figure 2. A Visual Schematic of the proposed accelerometer redeployment concept.
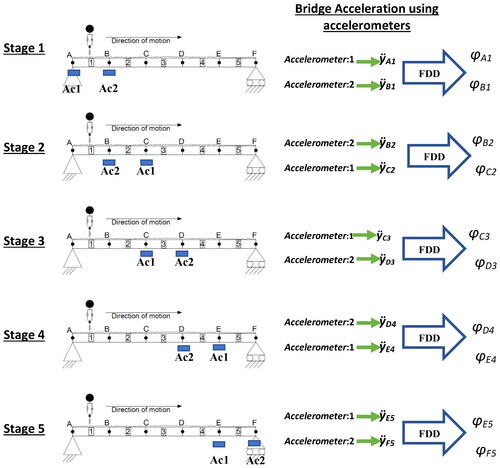
Figure 3. SVD Diagrams for (a) stage 1; (b) stage 2; (c) stage 3; (d) stage 4; (e) stage 5.
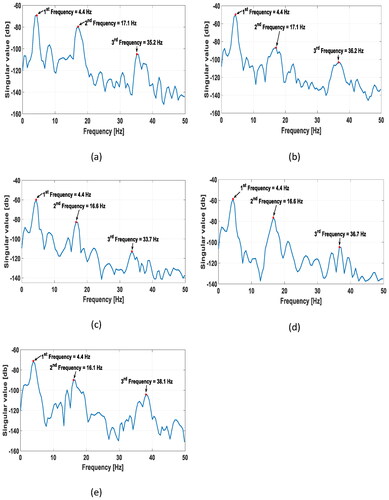
Figure 4. Bridge mode shapes measured using the concept of moving sensors: (a) 1st mode shape; (b) 2nd mode shape; (c) 3rd mode shape; MAC = Modal Assurance Criterion.
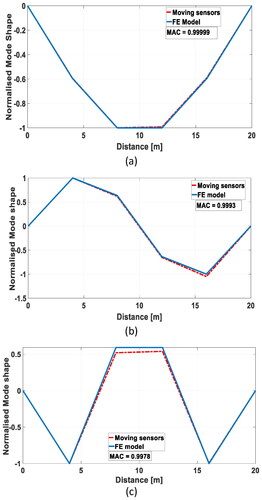
Figure 5. Numerically obtained first mode shape of an idealized bridge with different damage constraints at the boundaries.
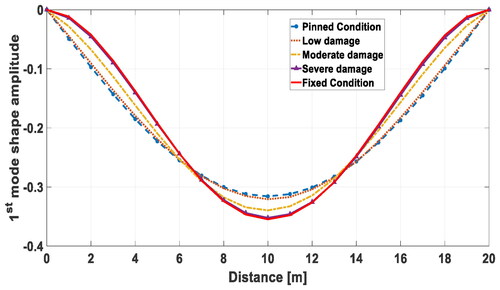
Table 3. First natural frequency of an idealized bridge for different percentages of Krot obtained numerically.
Figure 6. Numerically obtained First Mode shape gradient for different support stiffnesses for an idealized bridge.
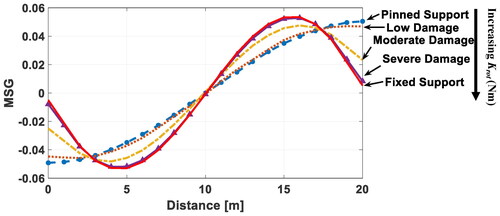
Figure 7. Flowchart of the proposed approach.
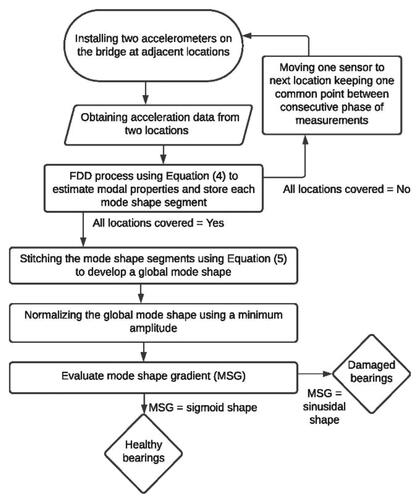
Figure 8. The Oranmore Bridge: (a) North side from the South; (b) top of the bridge from the West.
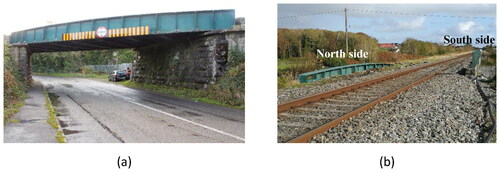
Figure 9. Support conditions of the Oranmore bridge - before rehabilitation: (a) primary longitudinal beam; (b) tertiary beam.
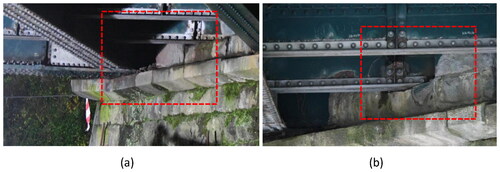
Figure 10. The rehabilitation of Oranmore bridge: (a) deck lift; (b)view on top of new precast concrete abutments and bearings; (c) bridge support bearing installation; and (d) side view of new precast concrete abutments.
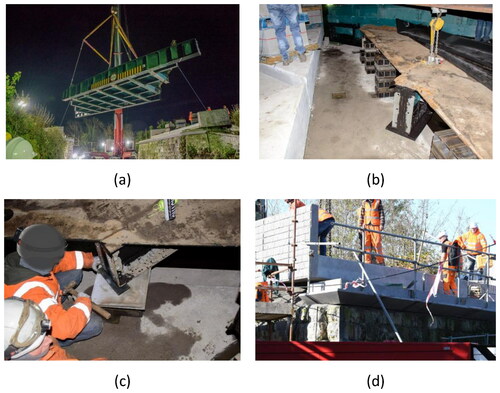
Figure 11. Meaurement locations on primary beam on North side: (a) elevation with dimensions (in mm) and percentage of span; (b) photograph.
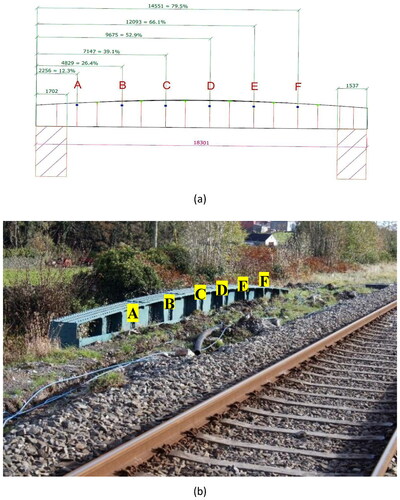
Table 4. Technical specifications of LORD G-Link/LXRS accelerometers.
Figure 12. Acceleration signals (forced and free vibrations) from bridge locations C and D (before rehabilitation); (a) in time domain; and (b) in frequency domain.
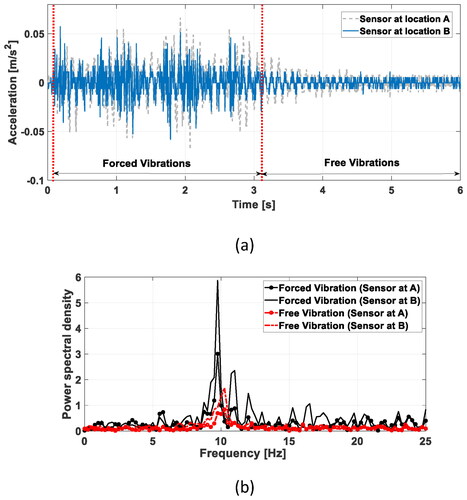
Figure 13. The Oranmore bridge numerical model: (a): the FE model; (b) calculated 1st bridge mode shape; and (c) the 1st bridge mode shape gradient.
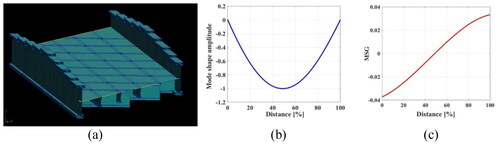
Table 5. First bridge natural frequency from the bridge accelerations to each passing train at UBG165.
Figure 14. Normalised 1st bridge mode shape of the Oranmore bridge from 243 combinations: (a) before rehabilitation; (b) after rehabilitation.
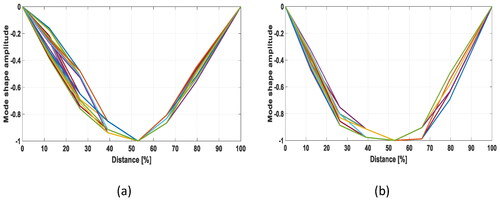
Figure 15. Mean ± one standard deviation of 1st bridge mode shape before and after the rehabilitation; (a) using 243 combinations; (b) using Monte Carlo estimation.
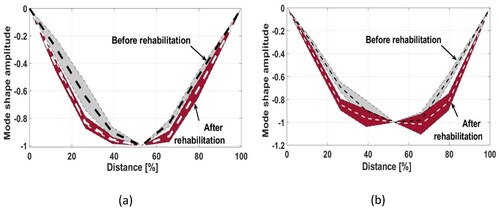
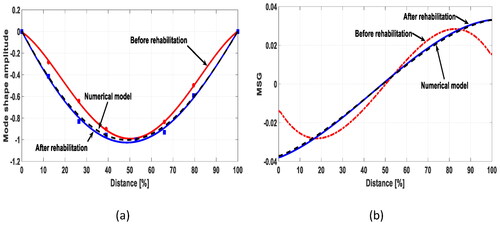
Figure 16. Damage indicators before and after rehabilitation; (a) fitted 1st bridge mode shape; (b) Mode Shape Gradient (MSG).