Figures & data
Figure 1. Schematic illustration of the applied method.
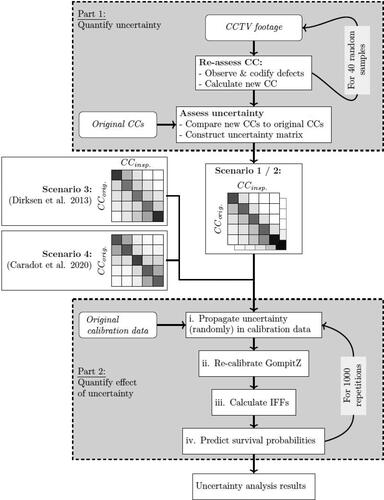
Figure 2. Bar chart showing the deviation between this project's and professional pipe inspector’s condition classification of the same CCTV video and the derived uncertainty matrix showing the probability of a pipe to be really in condition y when inspected in condition x.
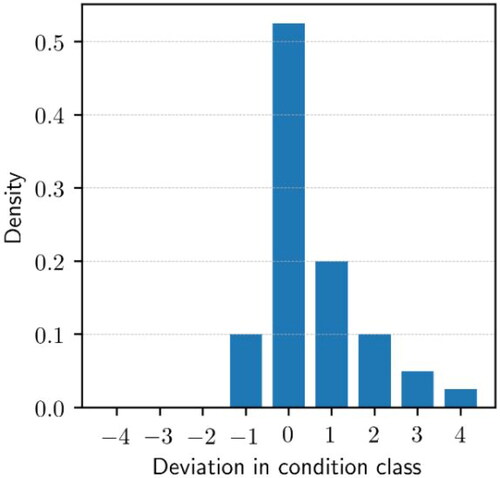
Table 1. Uncertainty matrices for scenario 3 and 4.
Table 2. Uncertainty matrix for scenario 1 and 2.
Table 3. Distribution (%) of installation periods and observed CC for concrete pipes.
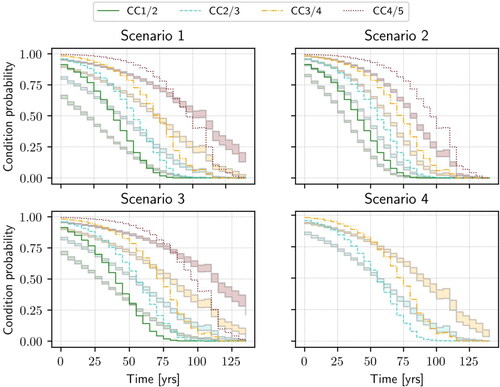
Figure 3. Condition probabilities of the calibrated GompitZ model with IFF and the corresponding uncertainty bands for the four defined scenarios.
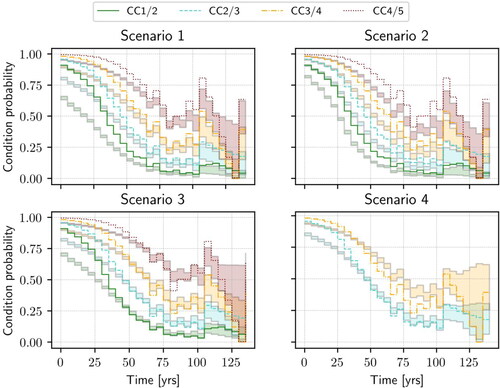
Figure 4. Condition probabilities of the calibrated marginal GompitZ model and the corresponding uncertainty bands for the four defined scenarios.