Figures & data
Table 1. Overview of suitability of common geophysical methods for detecting targets of interest on battlefield sites under appropriate pedological and archaeological conditions. Within each category, the individual characteristics of particular targets are varied and will be better suited to detection via different instruments/properties (further examined in the targets section below). (KEY: **** - excellent, *** - good, ** - mediocre, * - poor).
Figure 1. An example of modelled mass (left) and depth (right) of metal anomalies at a WW1 battlefield based on electrical conductivity of multiple coil pairs from an FDEM dataset. Validation of the dataset yielded ordnance or shrapnel at all (20) sampled locations where metal was predicted. Reproduced with permission (Saey et al. Citation2011Figure 10).
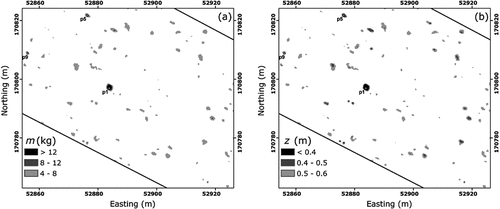
Figure 2. Example of magnetometry dataset with single grave features appearing as negative (dark) anomalies at a 17th-century cemetery in Kazakhstan. Reproduced with permission (Fassbinder Citation2016).Figure 6
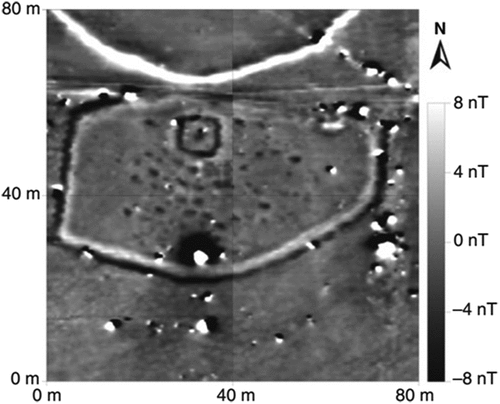
Figure 3. A likely grave shaft (without casket) seen in a GPR profile, identified by the interruption of the natural stratigraphy and low-amplitude reflections within the fill. Reproduced with permission (Conyers Citation2006) Figure 4.
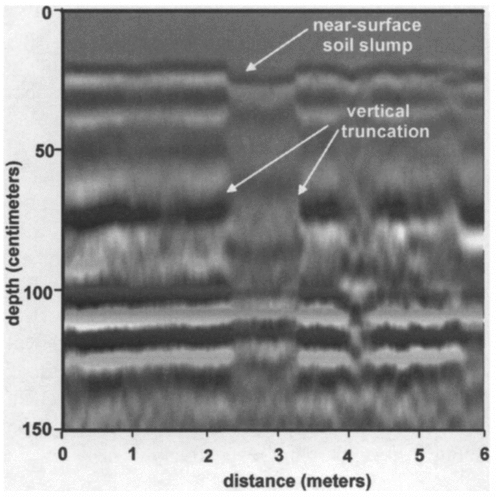
Figure 4. GPR amplitude slice map from Fountains Abbey (UK) showing individual graves as high amplitude anomalies (darker shaded discrete variations). Reproduced with permission (Gaffney et al. Citation2018).Figure 2
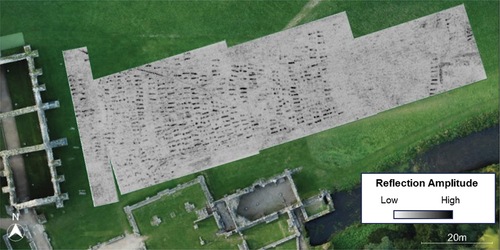
Figure 5. An apparent conductivity dataset from an EMI survey, showing bastions/ramparts (high conductivity, example indicated by the bounding box) and ditches (lower conductivity, example indicated by the black arrow) associated with a 17th-century Spanish fortification in Belgium (Poulain and De Clercq Citation2015, 634).
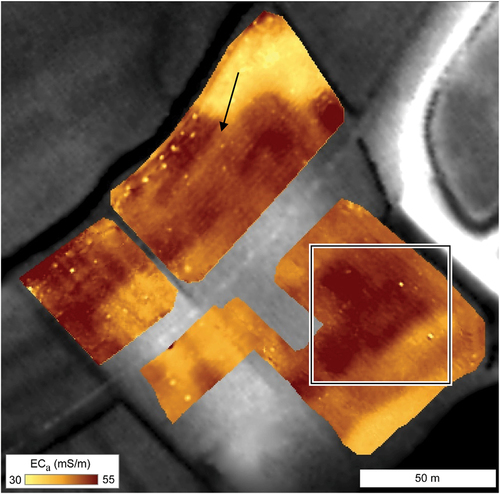
Figure 6. Magnetic susceptibility (EMI – left) and flux density (magnetometry – right) data showing ditch features (linear strongly magnetic anomalies indicated by arrows) associated with the Roman siege of Gergovia, France. Reproduced with permission (Simon et al. Citation2019Figure 2).
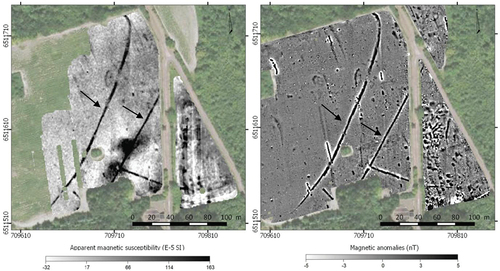
Figure 7. Magnetic anomaly in magnetometry and EMI data associated with a Civil War rifle pit at Tebbs Bend, Kentucky, USA. Reproduced with permission (Henry, Mink, and Stephen McBride Citation2017).
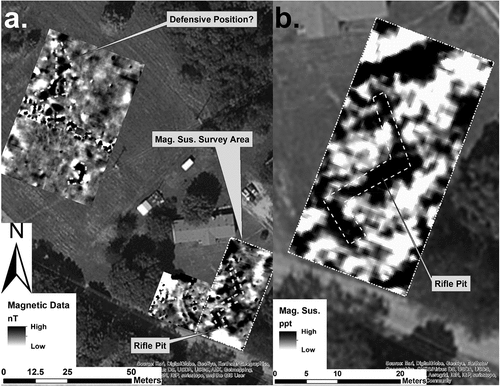
Figure 8. Magnetometry dataset from an 18th-century military encampment in Dorset. The annular features in the centre of the image are interpreted as remains of cookpits/field kitchens. Reproduced with permission (Barker Citation2015 ).
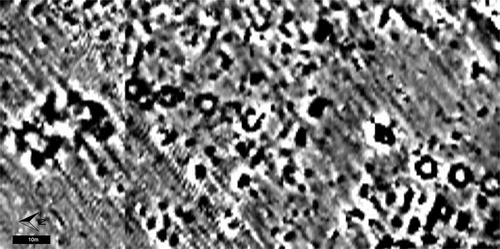
Figure 9. EMI dataset showing clear electrical contrasts (left) indicating enclosure ditch features at a medieval abbey in Belgium. Note also the rectilinear feature visible at top right in the magnetic susceptibility data (right), the individual anomalies of which represent brick structural foundations (De Smedt, Van Meirvenne, et al. Citation2013).
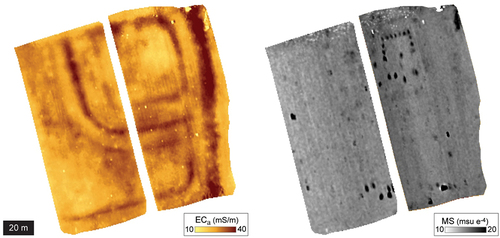
Figure 10. Magnetometry dataset from the battlefield of Waterloo showing rectilinear anomaly outlined in red, which was revealed to be the remains of a 19th-century brick structure upon excavation (Bosquet et al. forthcoming Citation2023).
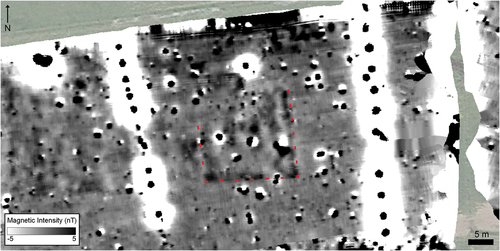
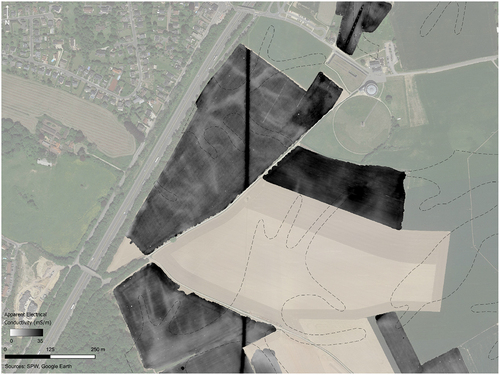
Figure 11. Apparent conductivity data from FDEM survey at the battlefield of Waterloo. Dashed lines indicate colluvial deposits (eroded soils) mapped in the mid-20th century (Louis Citation1958). These correlate with low-conductivity (lighter-toned) features in the FDEM dataset, providing more detail on the distribution of these deposits.