Figures & data
Figure 1. Crack branches with high and low stress.
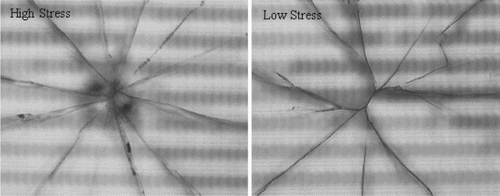
Figure 2. Fracture surface I (mirror radius (R) = 95.265 µm; fracture stress = 194.52 MPa).
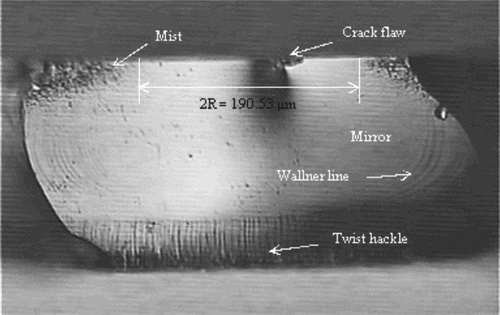
Figure 3. Fracture surface II (mirror radius (R) = 39.595 µm; fracture stress = 301.72 MPa).
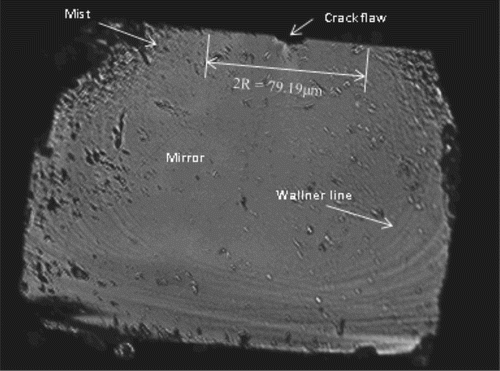
Figure 4. Fracture surface III (mirror radius (R) = 21.095 µm; fracture stress = 413.37 MPa).
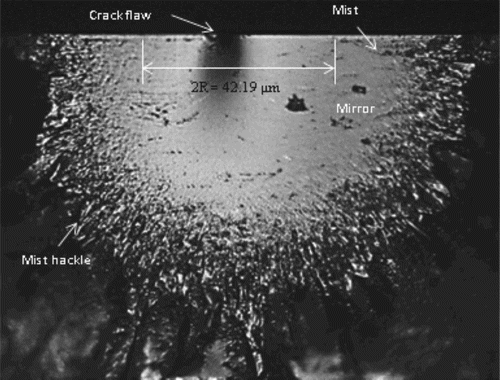
Figure 5. Four-probe bend test.
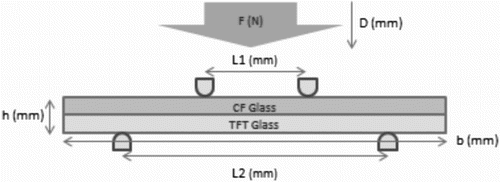
Table 1. Measurement and calculation results according to the ball drop test.
Figure 6. Four-probe bend test results.
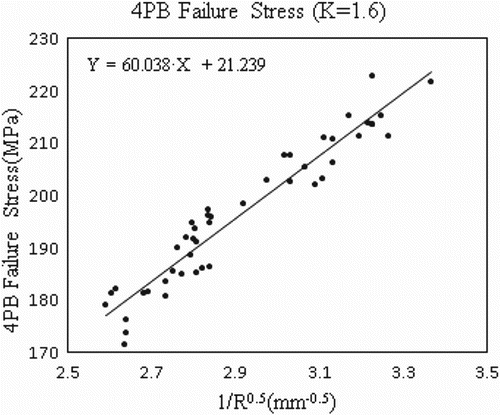
Figure 7. Ball drop test.
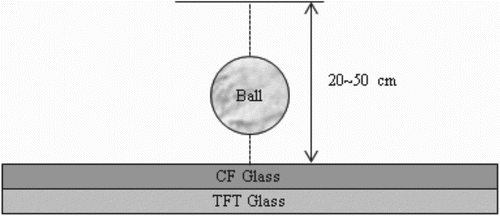
Figure 8. Ball drop test results: crack flaw vs. mirror radius.
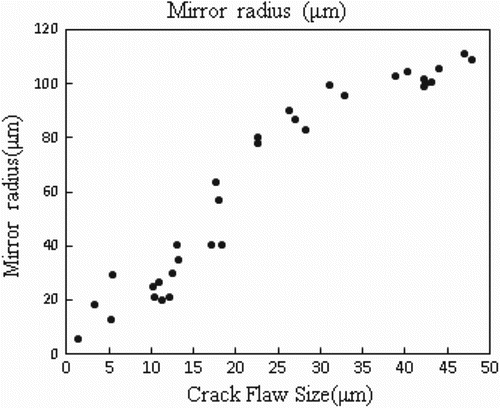
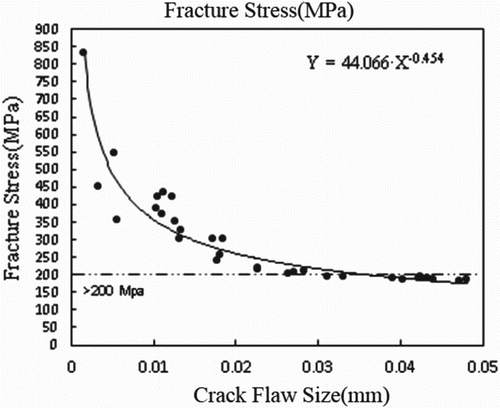
Figure 9. Ball drop test results: crack flaw vs. fracture stress.