Figures & data
Figure 1. Chemical structures of the BC molecule, TMPTA, and RM257.
Table 1. Constituent fractions of the precursors prepared in this work (wt%).
Figure 2. Typical POM images for P-R, P-G, and P-B during the cooling process (1°C/min). POM images for the ISO, unknown, and N* phases were observed at 60°C, 35°C, and 25°C, respectively.
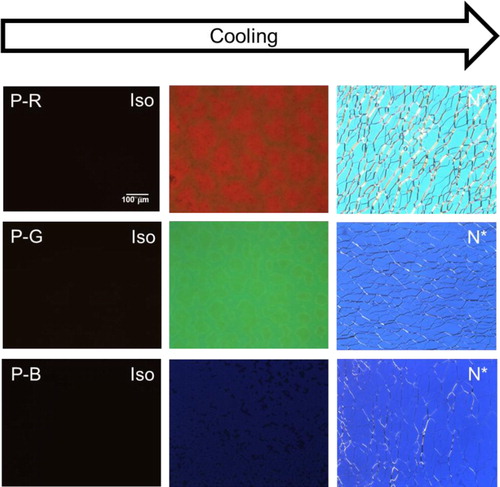
Figure 3. Plots of the temperature dependence of the maximum Bragg reflection wavelengths of P-R, P-G, and P-B.
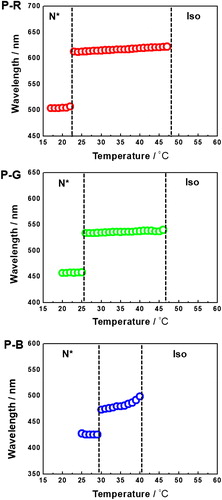
Figure 4. Typical POM images and Bragg reflection spectra for a range of temperatures for PSBPII.
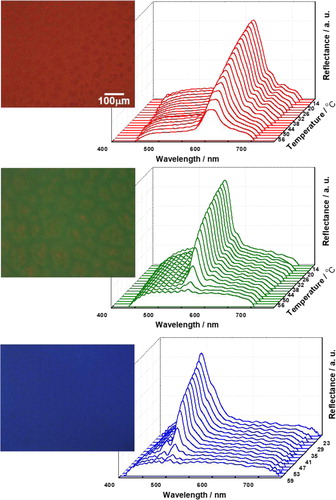
Figure 5. Temperature dependence of the reflection peak wavelength for a range of temperatures for PSBPII with red, green, and blue reflective colors.
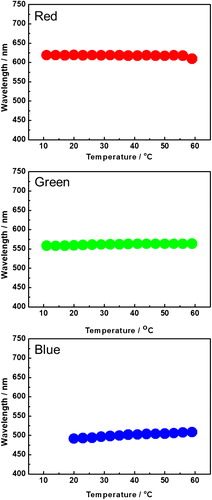
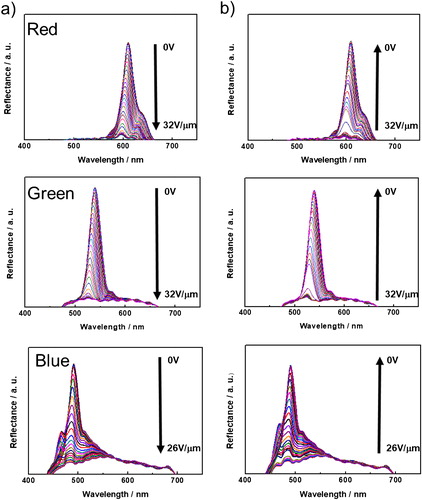
Figure 6. Reflectance spectra of the PSBPII samples according to the (a) increasing and (b) decreasing electric field at RT.