Figures & data
Figure 1. Four different types of video contents: Swiss – day, Dubai – night, Board – high speed, Phantom – low speed.
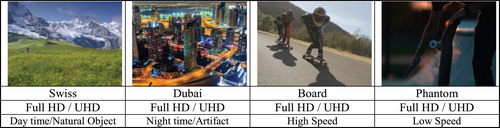
Figure 2. Experiment procedure for a single video content (Q; assessment of visual comfort and image quality).
Figure 3. Actual surrounding environment conditions (illuminance level): (a) 250 lx; (b) 0.6 lx.
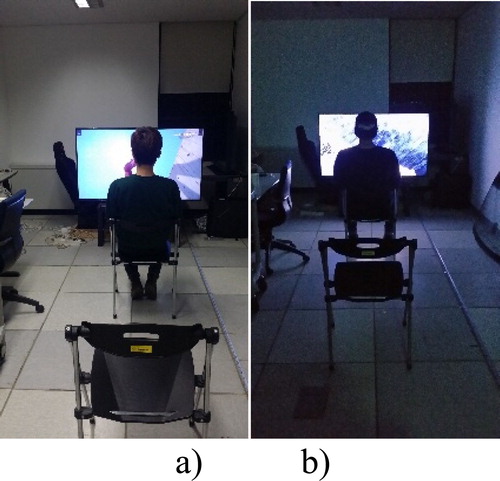
Table 1. Viewing conditions.
Table 2. Correlation coefficients of image quality and visual comfort against viewing distance, s the adult and elderly groups.
Figure 4. Image quality score for UHD and FHD when viewing the ‘Board’ and ‘Dubai’ video contents for the young adult group.
Figure 5. Image quality score for UHD and FHD when viewing the ‘Swiss’ and ‘Phantom’ video contents for the young adult group.
Figure 6. Image quality score for UHD and FHD when viewing the video content for the elderly group.
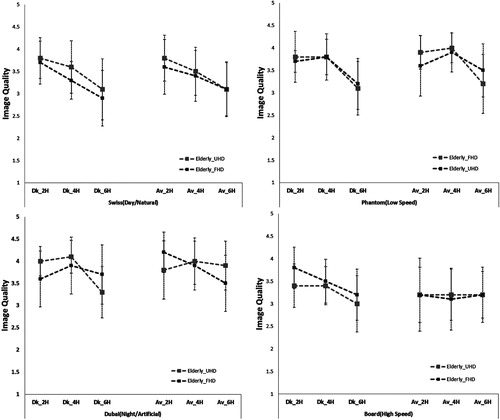
Figure 7. Visual comfort score for UHD and FHD when viewing the video content for the young adult group.
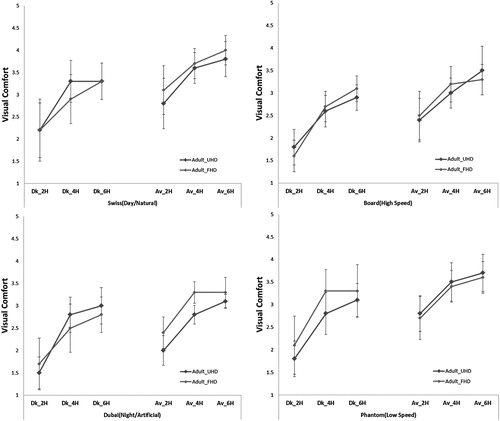
Figure 8. Visual comfort score for UHD and FHD when viewing the video content for the elderly group.
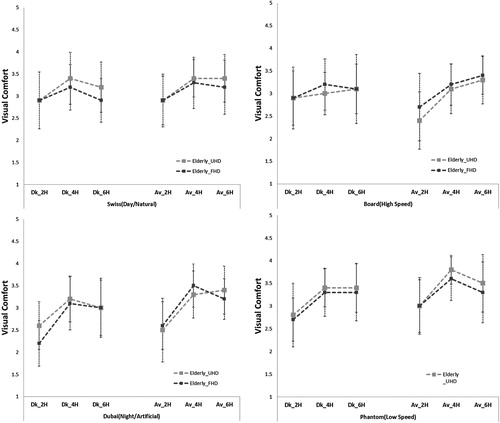
Figure 9. Image quality and visual comfort scores for UHD when viewing the ‘Swiss’ video content for each age group.
Figure 10. Image quality and visual comfort scores for UHD when viewing the ‘Dubai’ video content for each age group.
Figure 11. Image quality and visual comfort scores for UHD when viewing the ‘Board’ video content for each age group.
Table 3. ANOVA results for viewing environment affecting the image quality and visual comfort.
Figure 12. Visual comfort score according to the illuminance level for UHD when viewing a video content for the young adult group.
Figure 13. Image quality score according to the illuminance level for UHD when viewing a video content for the young adult group.
Table 4. ANOVA results for viewing distance affecting the image quality and visual comfort.
Figure 14. Visual comfort score according to the illuminance level for UHD when viewing a video content for the elderly group.
Figure 15. Image quality score according to the illuminance level for UHD when viewing a video content for the elderly group.
Figure 16. Image quality and visual comfort scores for UHD for the ‘Swiss’ and ‘Dubai’ video contents for each age group.
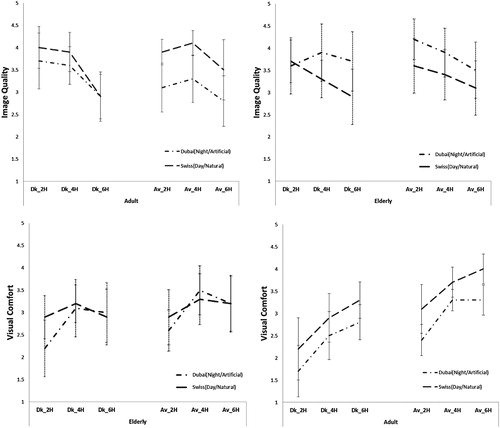
Figure 17. Image quality and visual comfort scores for UHD for the ‘Board’ and ‘Phantom’ video contents for each age group.
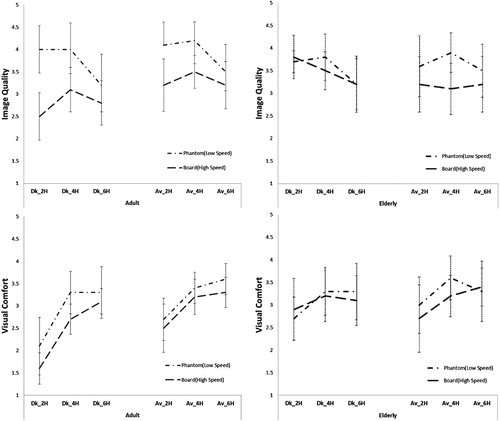
Figure 18. ‘Visual comfort distance’ considering different conditions for the young adult (left) and elderly (right) groups.
Figure 19. Recommended ‘visual comfort distance’ of the various types of video content in UHD for the adult and elderly groups under dark and average surrounding conditions.