Figures & data
Figure 1. Powder XRD patterns of the Li3BaSrLn3−x(MoO4)8:xSm3+ [Ln = (a) La, (b) Gd, and (c) Y] phosphor.
![Figure 1. Powder XRD patterns of the Li3BaSrLn3−x(MoO4)8:xSm3+ [Ln = (a) La, (b) Gd, and (c) Y] phosphor.](/cms/asset/8474cd0e-6bb5-4753-9159-4a70e2d29530/tjid_a_1831630_f0001_oc.jpg)
Figure 2. Powder XRD patterns of the Li3BaSrLn3−x(WO4)8:xSm3+ [Ln = (a) La, (b) Gd, and (c) Y] phosphor.
![Figure 2. Powder XRD patterns of the Li3BaSrLn3−x(WO4)8:xSm3+ [Ln = (a) La, (b) Gd, and (c) Y] phosphor.](/cms/asset/26a61637-6a18-49f1-97f8-20e3e689d548/tjid_a_1831630_f0002_oc.jpg)
Figure 3. (a and b) Crystal structure of the Li3BaSrY3(MoO4)8 phosphor, and (c) coordination of Ba, Y/Li(1), and Li(2) with oxygen.
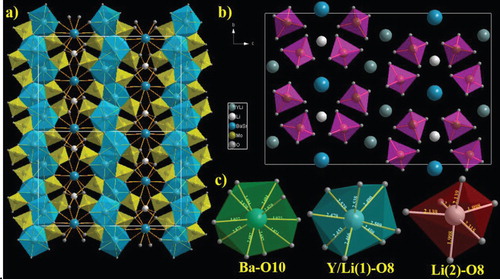
Figure 4. SEM image of the Sm3+-activated Li3BaSrLn3(MoO4)8 [Ln = (a and b) La, (c and d) Gd, and (e and f) Y] phosphor.
![Figure 4. SEM image of the Sm3+-activated Li3BaSrLn3(MoO4)8 [Ln = (a and b) La, (c and d) Gd, and (e and f) Y] phosphor.](/cms/asset/335eb4b0-1f29-4142-8503-e4fdb48dfbfe/tjid_a_1831630_f0004_oc.jpg)
Figure 5. SEM image of the Sm3+-activated Li3BaSrLn3(WO4)8 [Ln = (a and b) La, (c and d) Gd, and (e and f) Y] phosphor.
![Figure 5. SEM image of the Sm3+-activated Li3BaSrLn3(WO4)8 [Ln = (a and b) La, (c and d) Gd, and (e and f) Y] phosphor.](/cms/asset/0cf293b8-895e-4e14-beb8-5dc771511ce0/tjid_a_1831630_f0005_oc.jpg)
Figure 6. (a) FT-IR spectrum of the Li3BaSrLn3(MoO4)8 (Ln = La, Gd, and Y) and (b) Li3BaSrLn3(WO4)8 (Ln = La, Gd, and Y) phosphors.
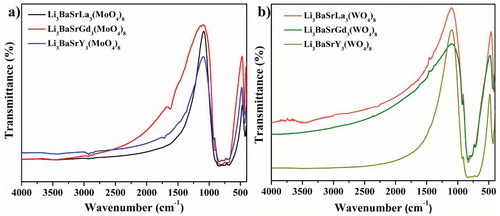
Figure 7. PLE (LHS) and PL (RHS) spectra of the Li3BaSrLn3(MoO4)8:Sm3+ [Ln = (a and b) La, (c and d) Gd, and (e and f) Y] phosphor.
![Figure 7. PLE (LHS) and PL (RHS) spectra of the Li3BaSrLn3(MoO4)8:Sm3+ [Ln = (a and b) La, (c and d) Gd, and (e and f) Y] phosphor.](/cms/asset/560572e6-3942-4f73-8412-96c130617950/tjid_a_1831630_f0007_oc.jpg)
Figure 8. PLE (LHS) and PL (RHS) spectra of the Li3BaSrLn3(WO4)8:Sm3+ [Ln = (a and b) La, (c and d) Gd, and (e and f) Y] phosphor.
![Figure 8. PLE (LHS) and PL (RHS) spectra of the Li3BaSrLn3(WO4)8:Sm3+ [Ln = (a and b) La, (c and d) Gd, and (e and f) Y] phosphor.](/cms/asset/870003b7-3448-4114-b0e8-fc49a9377429/tjid_a_1831630_f0008_oc.jpg)
Figure 9. PL emission intensity of the 4G5/2→6H9/2 transition of the Li3BaSrLn3(MoO4)8:Sm3+ [Ln = (a) La, (b) Gd, and (c) Y] phosphor; and (d) overall emission intensity of the Sm3+-doped Li3BaSrLn3(MoO4)8 (Ln = La, Gd, and Y) phosphor.
![Figure 9. PL emission intensity of the 4G5/2→6H9/2 transition of the Li3BaSrLn3(MoO4)8:Sm3+ [Ln = (a) La, (b) Gd, and (c) Y] phosphor; and (d) overall emission intensity of the Sm3+-doped Li3BaSrLn3(MoO4)8 (Ln = La, Gd, and Y) phosphor.](/cms/asset/76abe241-fdf6-4401-8fc2-b058176fa2ad/tjid_a_1831630_f0009_oc.jpg)
Figure 10. PL emission intensity of the 4G5/2→6H9/2 transition of the Li3BaSrLn3(WO4)8:Sm3+ [Ln = (a) La, (b) Gd, and (c) Y] phosphor; and (d) overall emission intensity of the Sm3+-doped Li3BaSrLn3(WO4)8 (Ln = La, Gd, and Y) phosphor.
![Figure 10. PL emission intensity of the 4G5/2→6H9/2 transition of the Li3BaSrLn3(WO4)8:Sm3+ [Ln = (a) La, (b) Gd, and (c) Y] phosphor; and (d) overall emission intensity of the Sm3+-doped Li3BaSrLn3(WO4)8 (Ln = La, Gd, and Y) phosphor.](/cms/asset/acc032f4-5303-4a20-b6db-fb105137de46/tjid_a_1831630_f0010_oc.jpg)
Figure 11. Relationship between log C and log (I/C) for the Li3BaSrLn3(MO4)8:Sm3+ [Ln = La, Gd, and Y; M = Mo (LHS) and W (RHS)] phosphors.
![Figure 11. Relationship between log C and log (I/C) for the Li3BaSrLn3(MO4)8:Sm3+ [Ln = La, Gd, and Y; M = Mo (LHS) and W (RHS)] phosphors.](/cms/asset/45b66478-b7bc-4662-b667-4967bae42124/tjid_a_1831630_f0011_oc.jpg)
Figure 12. (a) Energy level diagram, and (b) cross-relaxation mechanism of the Sm3+ ion in the Li3BaSrLn3(MO4)8 lattice.
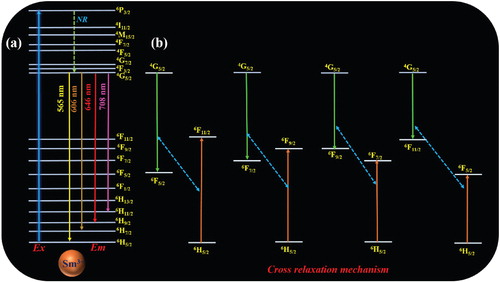
Figure 13. Schematic diagram of the energy transfer from MoO42– to the Sm3+ ion.
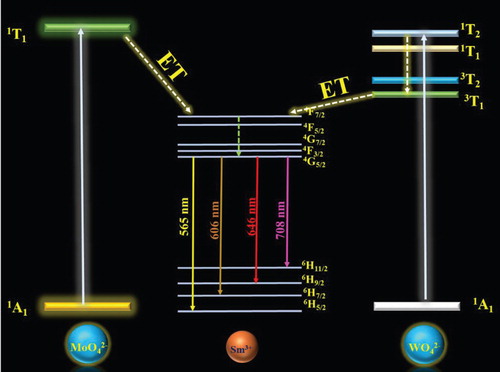
Figure 14. Decay curve of the Sm3+-activated Li3BaSrLn3(MoO4)8 [Ln = (a) La, (c) Gd, and (e) Y] phosphor; and (b, d, and f) lifetime values of all the phosphors.
![Figure 14. Decay curve of the Sm3+-activated Li3BaSrLn3(MoO4)8 [Ln = (a) La, (c) Gd, and (e) Y] phosphor; and (b, d, and f) lifetime values of all the phosphors.](/cms/asset/974a7110-4eff-4e77-b42b-0d422dcfc2fd/tjid_a_1831630_f0014_oc.jpg)
Figure 15. Decay curve of the Sm3+-activated Li3BaSrLn3(WO4)8 [Ln = (a) La, (c) Gd, and (e) Y] phosphor; and (b, d, and f) lifetime values of all the phosphors.
![Figure 15. Decay curve of the Sm3+-activated Li3BaSrLn3(WO4)8 [Ln = (a) La, (c) Gd, and (e) Y] phosphor; and (b, d, and f) lifetime values of all the phosphors.](/cms/asset/8e036cc8-ecf9-4b67-8e61-8340adb39d35/tjid_a_1831630_f0015_oc.jpg)
Figure 16. Temperature-dependent PLs of the Sm3+-activated Li3BaSrLn3(MoO4)8 phosphors [Ln = (a) La, (c) Gd, and (e) Y] and Arrhenius plot of the Li3BaSrLn3(MoO4)8 phosphors [Ln = (b) La, (d) Gd, and (f) Y].
![Figure 16. Temperature-dependent PLs of the Sm3+-activated Li3BaSrLn3(MoO4)8 phosphors [Ln = (a) La, (c) Gd, and (e) Y] and Arrhenius plot of the Li3BaSrLn3(MoO4)8 phosphors [Ln = (b) La, (d) Gd, and (f) Y].](/cms/asset/3cedd39c-3a03-4ad1-b63f-d490e949d58b/tjid_a_1831630_f0016_oc.jpg)
Figure 17. Temperature-dependent PLs of the Sm3+-activated Li3BaSrLn3(WO4)8 phosphors [Ln = (a) La, (c) Gd, and (e) Y]; and Arrhenius plot of the Li3BaSrLn3(WO4)8 phosphors [Ln = (b) La, (d) Gd, and (f) Y].
![Figure 17. Temperature-dependent PLs of the Sm3+-activated Li3BaSrLn3(WO4)8 phosphors [Ln = (a) La, (c) Gd, and (e) Y]; and Arrhenius plot of the Li3BaSrLn3(WO4)8 phosphors [Ln = (b) La, (d) Gd, and (f) Y].](/cms/asset/47e9c735-76d7-419d-b479-b7f2ef3fbc81/tjid_a_1831630_f0017_oc.jpg)
Figure 18. Normalized intensity variations of the Li3BaSrLn3(MO4)8 [Ln = La, Gd, and Y; M = (a) Mo and (b) W] phosphors at different temperatures.
![Figure 18. Normalized intensity variations of the Li3BaSrLn3(MO4)8 [Ln = La, Gd, and Y; M = (a) Mo and (b) W] phosphors at different temperatures.](/cms/asset/ecf9f29d-09ca-4b3e-8b0c-1bd3f6a263d2/tjid_a_1831630_f0018_oc.jpg)
Figure 19. CIE images of the Sm3+-activated Li3BaSrLn3(MoO4)8:Sm3+ (Ln = La, Gd, and Y) red-orange phosphors.
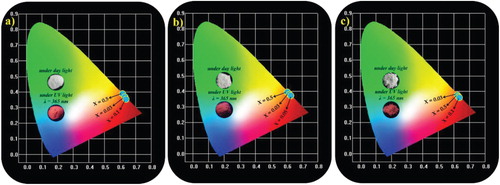
Figure 20. CIE images of the Sm3+-activated Li3BaSrLn3(WO4)8:Sm3+ (Ln = La, Gd, and Y) red-orange phosphors.
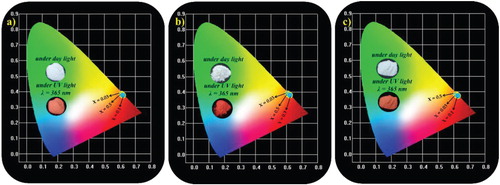
Figure 21. IQE measurement for the optimized composition of the Sm3+-activated Li3BaSrLn3(MO4)8 (Ln = La, Gd, and Y; M = Mo and W) phosphors.
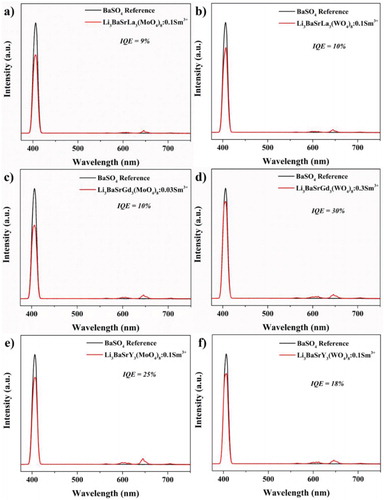
Figure 22. LED emission spectrum of the fabricated red-orange-emitting LED device from the combination of InGaN LED with the (a) Li3BaSrLn3(MoO4)8:Sm3+ (Ln = La, Gd, and Y) and (b) Li3BaSrLn3(WO4)8:Sm3+ (Ln = La, Gd, and Y) phosphors.
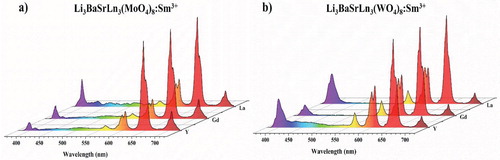
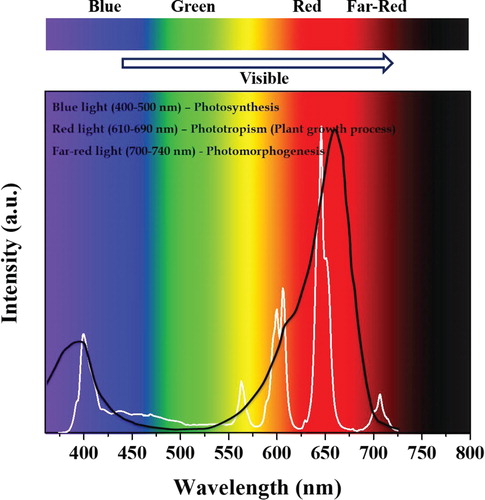
Figure 23. LED emission spectrum of the fabricated LED (Li3BaSrY3(WO4)8:Sm3+) and absorption of phytochrome Pr.