Figures & data
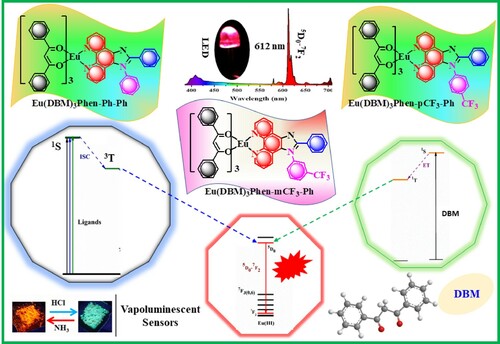
Figure 1. Chemical structures of the Eu(III) complexes with the respective substitutions.
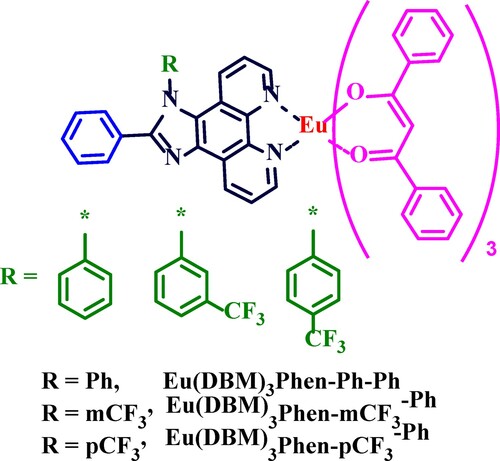
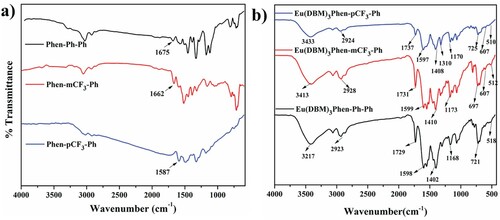
Figure 2. FT-IR spectra of (a) the ligands and (b) their corresponding Eu(III) complexes.
Scheme 1. Synthesis scheme for the ligands and the respective complexes.
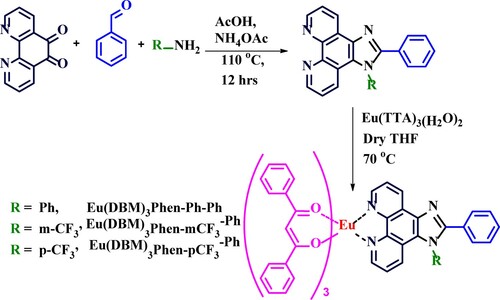
Figure 3. UV absorption spectra of the corresponding Eu(III) complexes.
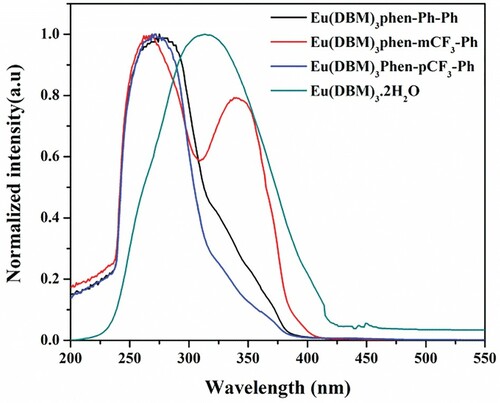
Table 1. Absorption, excitation, and emission of the ligands and the corresponding complexes in the solution and solid states.
Figure 4. (a) PL excitation and (b) emission spectra of the complexes in a solid form. The inset shows the CIE color coordinates.
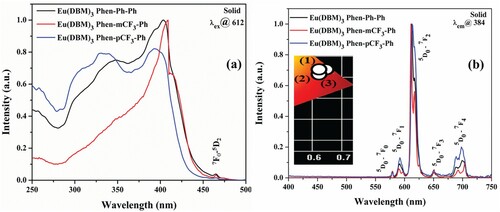
Figure 5. (a) PL excitation and (b) emission spectra of the complexes in solution (CHCl31 × 10−5 mol/L conc) form. The inset shows the CIE color coordinates.
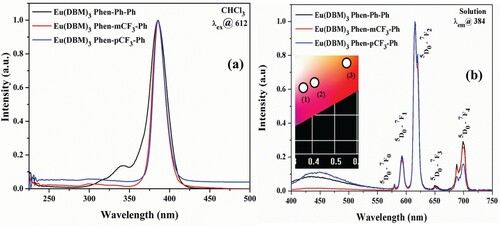
Figure 6. PL emission spectra of the Eu(III) complexes, Eu(DBM)3Phen-Ph-Ph, Eu(DBM)3Phen-mCF3-Ph, and Eu(DBM)3Phen-pCF3-Ph, in different solvents and their respective CIEs.
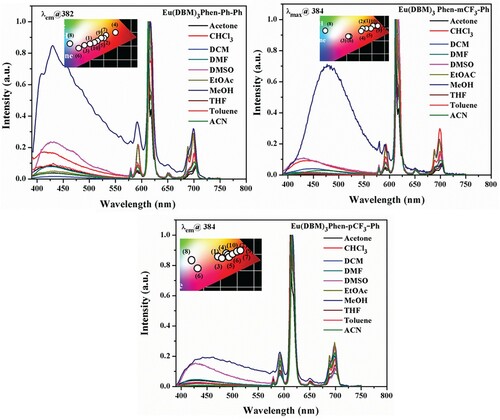
Table 2. Calculated luminescence lifetimes τobs and intensity parameters of the ligands and the corresponding Eu(III) complexes.
Table 3. Radiative properties and branching ratios of the complexes.
Figure 7. Decay curves of the luminescence of the Eu(III) complexes at λ = 612 nm.
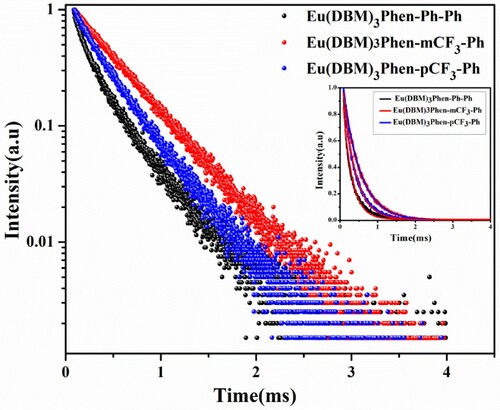
Figure 8. Schematic representation of the energy transfer process from the ligand as well as from DBM to the Eu(III) metal ion through its singlet and triplet excited states.
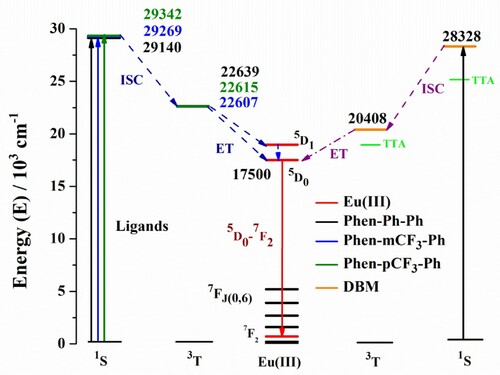
Figure 9. PL emission spectra of the fluorinated and non-fluorinated complexes in a thin film using the PMMA matrix.
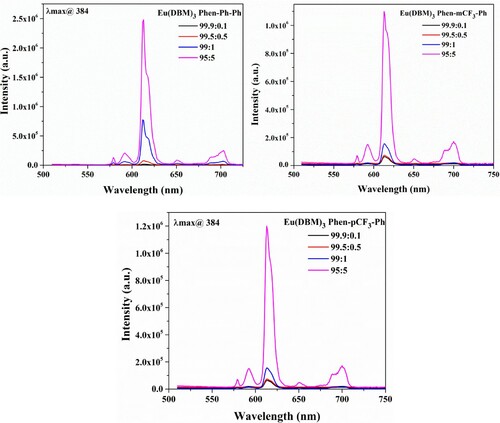
Figure 10. Cyclic voltammetry plots of the Eu(III) complexes.
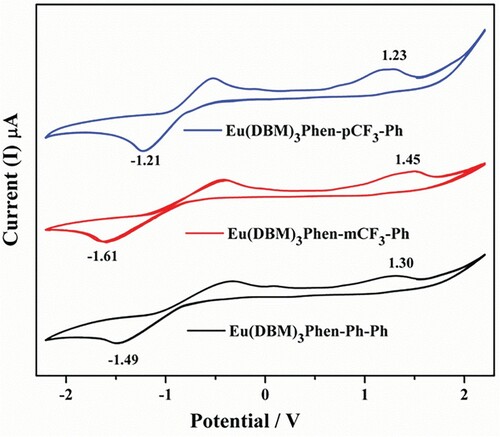
Table 4. Onset oxidation and reduction potentials of the ligands and complexes.
Figure 11. Emission spectra of the Eu(III) complex coated with the InGaN (395 nm)-emitted LED chip. The inset shows the forward bias coated with the Eu(III) complex.
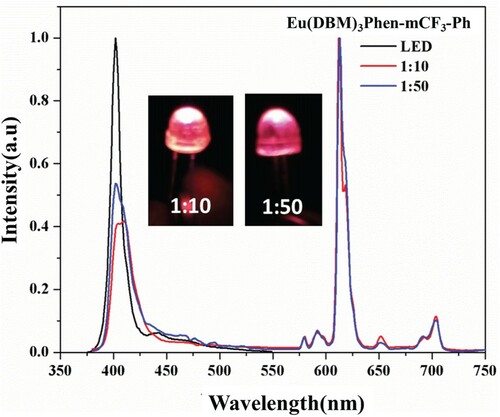
Table 5. CIE, color purity, and LER of the Eu complexes-based red LEDs.
Figure 12. Temperature-dependent PL emission spectra of Eu(DBM)3Phen-Ph-Ph, Eu(DBM)3Phen-mCF3-Ph, and Eu(DBM)3Phen-pCF3-Ph in the ACN solvent and their CIE color coordinates.
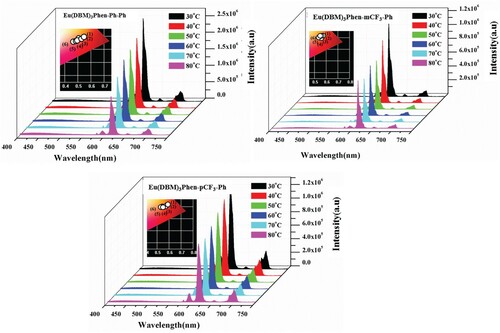
Figure 13. (a) Temperature-dependent Δ and linearly fitted curve. (b) Temperature-dependent relative sensitivity (SR).
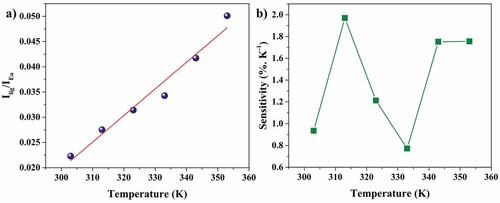
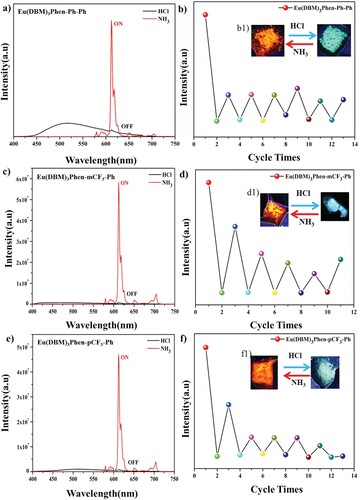
Figure 14. (a, b, and c) Emission spectra (λex = 385 nm) of the Eu(III) complexes. (b, d, and f) Responses of the 612 nm emission intensity of the Eu(DBM)3Phen-pCN-mCF3 complex during the HCl-NH3 exposure cycles (left inset). (b1, d1, and f1) Photographs of the Eu(III)complex during its exposure to NH3-HCl vapors under UV light (λex = 365 nm) and luminescence changes before and after exposure to NH3 vapors.