Figures & data
Figure 1. (a) Schematic illustrations of the BDLC film fabrication methods. (b) Molecular structure and differential scanning calorimetry curve of the reactive mesogen. (c) Polarized optical microscope images of the LC textures. The red and blue arrows indicate the alignment direction of the ‘red’ layer and the ‘cyan’ layer, respectively. The white arrows indicate the polarizer (P) and the analyzer (A). Scale bar = 100 μm.
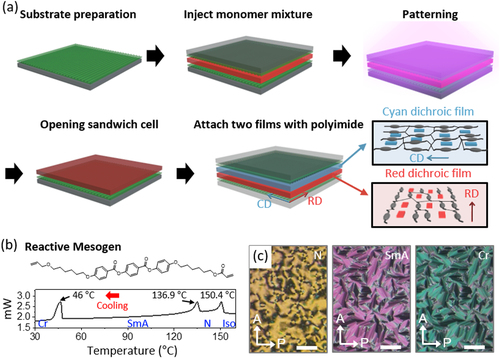
Figure 2. Polarized optical microscope images with a full-wave plate (λ = 530 nm) of (a) and (b) the uniaxially aligned single-layer dichroic dye-doped LC film (‘red’), and (c) and (d) the BDLC film. The white arrows indicate the polarizer (P) and the analyzer (A). The magenta arrow indicates the slow axis of the full-wave plate. Scale bar = 100 μm.
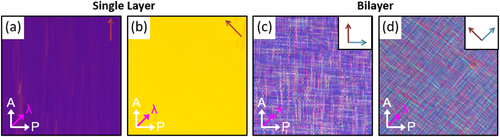
Figure 3. (a) Schematic illustration of the polarization dependency of the single-layer dichroic dye-doped LC films and the BDLC film. Optical microscope images of the transmission color change of the (b) ‘red’ single-layer film, (c) ‘cyan’ single-layer film, and (d) BDLC film, when θ was varied. Scale bar = 100 μm.
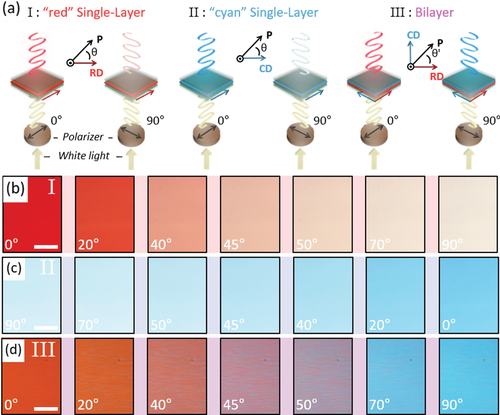
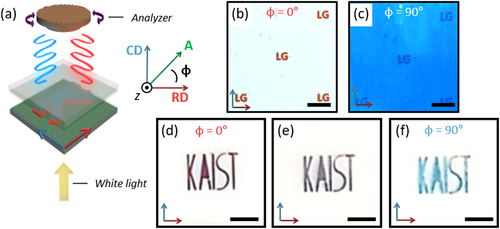
Figure 4. (a) Schematic illustration of the transmitted LPLs through the patterned BDLC film. Optical microscope images of the patternable codes with the letters ‘LG’ when (b) φ = 0° or (c) φ = 90°. Optical microscope images of the transmission color change observed in a security code patterned with the letters ‘KAIST’ without (f) an analyzer or when (d) φ = 0° or (e) φ = 90°. Scale bar: (b) and (c) = 1 mm and (d)–(f) = 5 mm.