
Figures & data
Figure 1. (a) Circuit diagram of the proposed amplifier and (b) timing diagram.
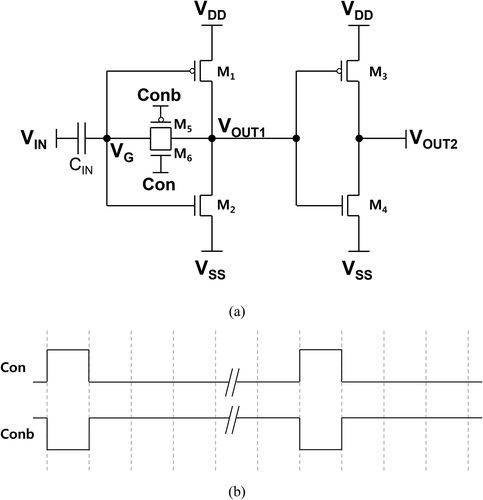
Figure 2. Determination of the operating point of the first amplifier by shorting the input and output.
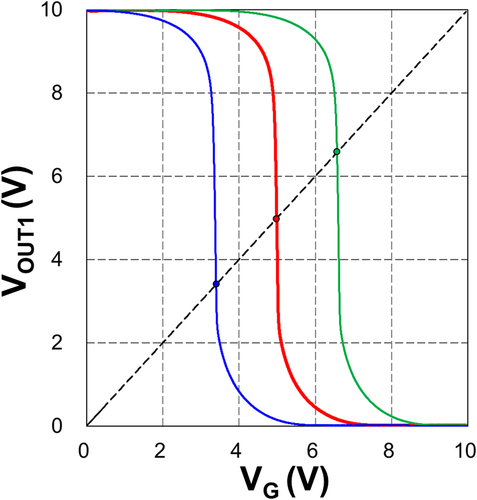
Figure 3. (a) Micrograph of the fabricated circuit, and (b) measured output characteristics of the n-type Corbino TFT with (R1, R2) = (72, 57 µm) and conventional bar-type TFT with W/L = 50 µm / 10 µm, (c) transfer curve, and (d) output curves of the n-type Corbino TFT with (R1, R2) = (72, 57 µm) and p-type Corbino TFT with (R1, R2) = (25 µm, 10 µm).
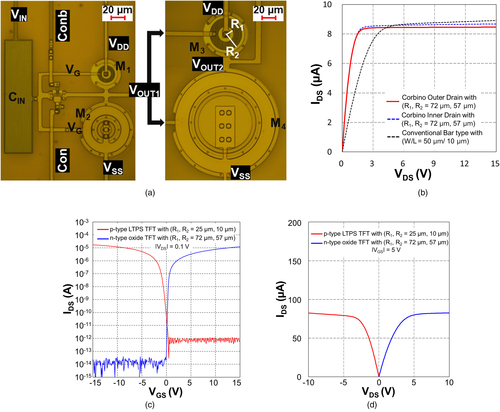
Table 1. Design parameters of the manufactured circuit.
Figure 4. Measurement output of the proposed amplifier when a 100 Hz sine wave with 2 mV peak-to-peak was applied.
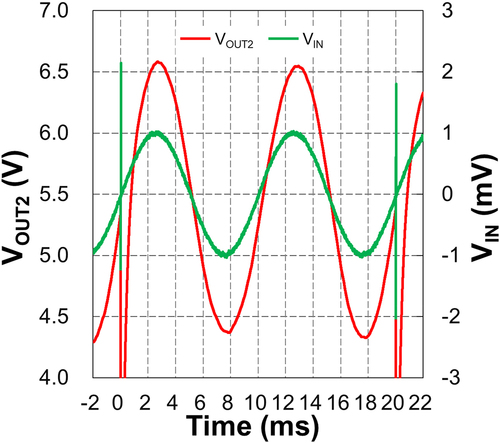
Figure 5. Measured transfer characteristics of the second amplifier and calculated voltage gain.
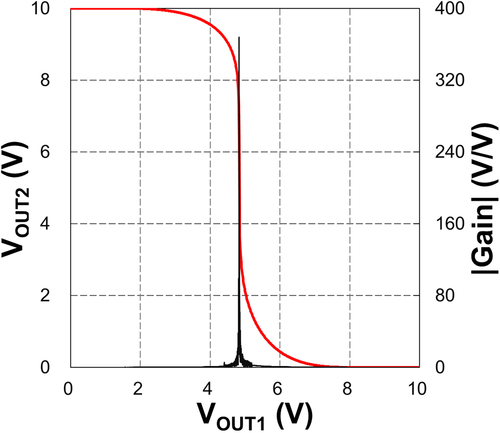
Figure 6. Measured voltage gain in dB depending on frequency.