Figures & data
Figure 1. (a) Cross-sectional view of a 6-inch flexible AMOLED display. (b) Heat diffusion concept in AMOLED panel with unit cell on top. Here, T refers to temperature and x, y represent the position of the unit cell. Note that a cluster of pixel array has TFTs and OLEDs, which is used for FDM calculation. Note that on the surface of the flexible AMOLED display, heat diffuses horizontally by conduction and vertically by convection, and the influence of convection in contact with air is much smaller than that of conduction.
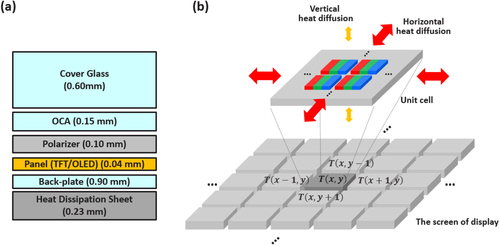
Figure 2. (a) Relationship between the increase in average temperature and normalized current increase compared to G0 image according to various input images in 6-inch flexible AMOLED display. Photograph of the measured temperature distribution during OLED driving with (b) G186 all over the panel and (c) top white and bottom black (WB) image. Note that in Figure (a,b), the bright parts show high temperature and the dark parts show relatively low temperature. The temperature in the bottom region of the display is relatively higher due to the impact of the driver IC.
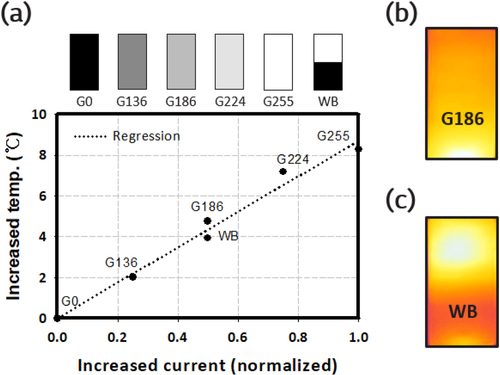
Figure 3. (a) Evaluation image for extracting heat diffusion parameters (,
). (b) Photograph of measured temperature distribution when driving (a) image. (c) Measured and regression graph of temperature distribution as a function of
in the display. Note that the regression curve with exponential form comes from the measured data to extract the diffusion parameters.
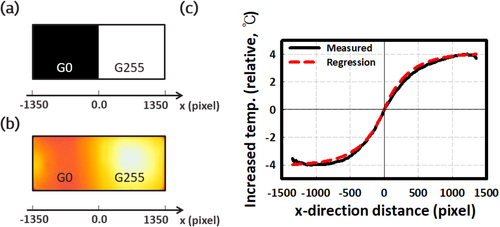
Figure 4. (a) Evaluation images and driving sequence for extracting the time constant. (b) Photograph of a measured temperature distribution when driving (a) images and sequence. (c) Measurement results and the regression graph of temperature distribution as a function of time.
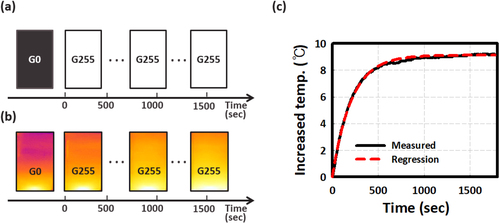
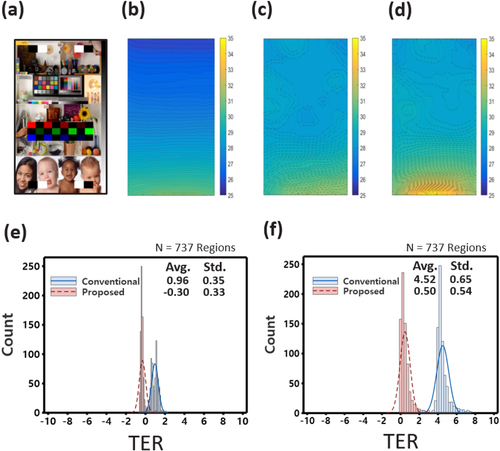
Figure 5. (a) Evaluation image. The simulated temperature profile for (b) the conventional method, (c) proposed method, and (d) the measured temperature profile, when driving 15 min after the transition from G0 to the evaluation image. Note that the scale bar shows the temperature. The temperature error, TER, is defined as the measured temperature minus the simulated temperature. The TER distribution between the conventional and the proposed method for (e) 1 min and (f) 15 min driving.