Figures & data
Figure 1. (a) Chemical structures of QPSMs, (b) device configuration, (c) chemical structures of SY, and (d) synthesis schemes for the QPSMs.
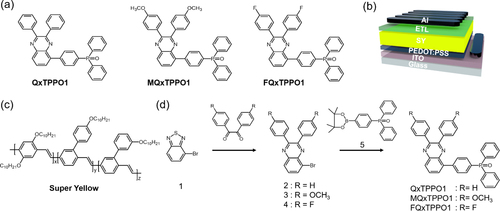
Figure 2. (a) TGA thermograms, (b) DSC thermograms, and (c) XRD data of QxTPPO1, MQxTPPO1, and FQxTPPO1, (d) UV-vis spectra in the chloroform solution, (e) CV curves of QxTPPO1, MQxTPPO1, and FQxTPPO1, and (f) Energy diagrams of all materials in the OLEDs.
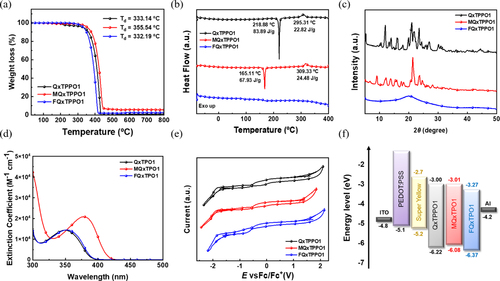
Table 1. Optical and electrochemical properties of QPSMs.
Figure 3. (a) Optimized geometry with the value of dipole moment of QxTPPO1, MQxTPPO1, and FQxTPPO1, (b) Schematic images of interfacial dipole moment and (c) Cathode work functions with and without ETL (scanning Kelvin probe measurement).
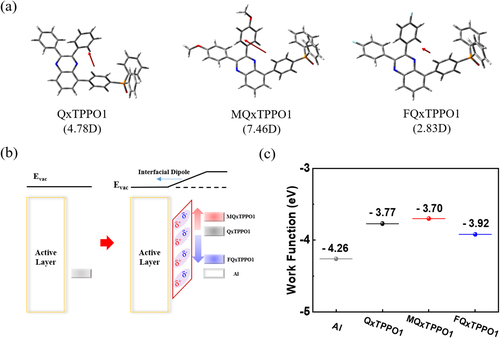
Figure 4. Device performance of OLEDs with QPSMs; (a) J-V curves, (b) L-V curves, (c) LE-L curves, and (d) EQE-L.
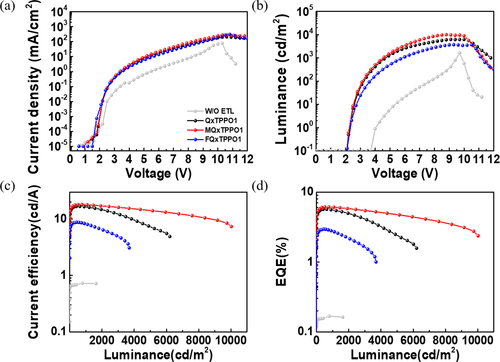
Table 2. Summarized device performance for OLEDs.
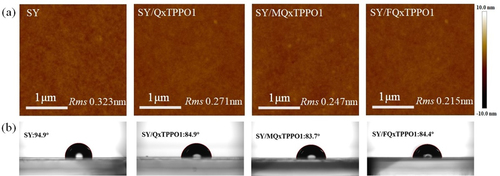
Figure 5. (a) Atomic force microscopy (AFM) images and (b) Contact angles on the SY with and without QSPMs such as QxTPPO1, MQxTPPO1 and FQxTPPO1.