Figures & data
Figure 1. Example of controlled generation of three-dimensional stretching (a) before stretching and (b) after stretching.
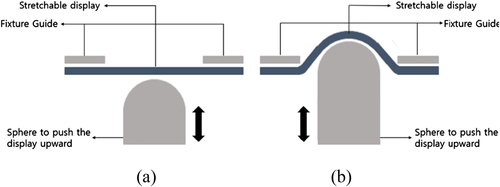
Figure 2. Schematic cross-sectional view to explain the proposed measures of three-dimensional stretchability.
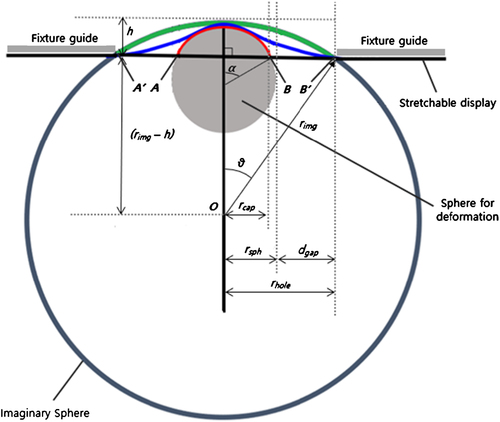
Table 1. Twenty-one configurations of controlled generation of three-dimensional stretching.
Figure 3. Graphs of and
versus
.
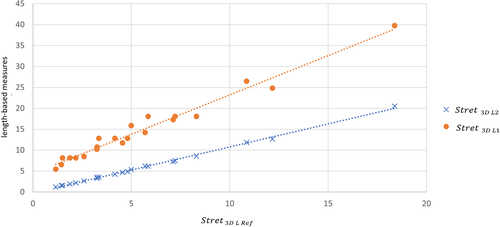
Figure 4. Graphs of and
versus
.
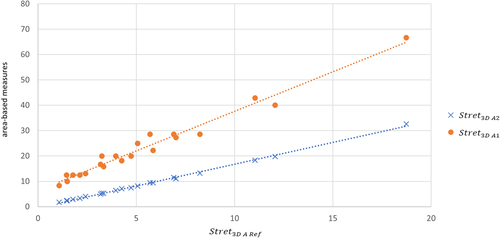
Figure 5. Percent errors of and
versus
.
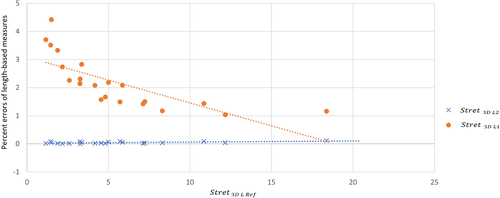
Figure 6. Percent errors of and
versus
.
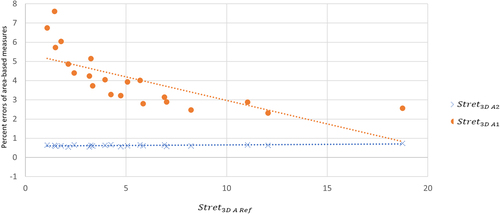
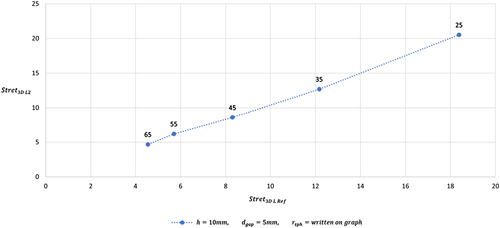
Figure 7. Effects of changing values of the gap on .
and the values of
are on the graph.
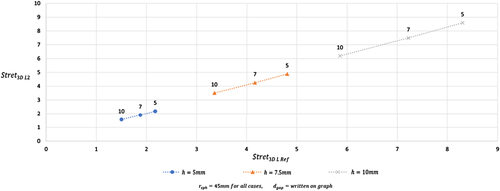
Figure 8. Effects of changing values of the sphere radius on .
and the values of
are on the graph.