
Figures & data
Figure 1. OLED structures for high-resolution microdisplay according to OLED manufacturing technology.
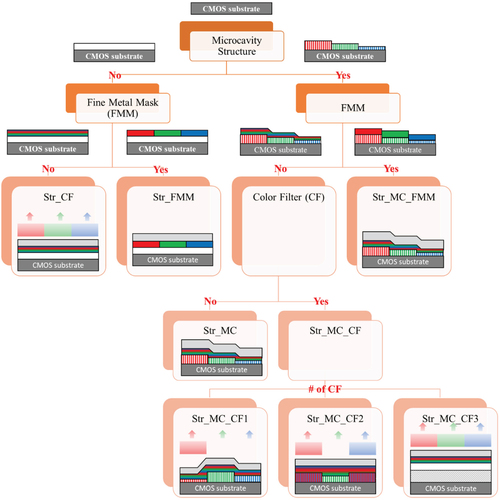
Figure 2. Electroluminescent spectrum of red, green, and blue emission in OLEDs with a structure of (a) str_CF, (b) str_MC, (c) str_MC_CF1, and (d) str_MC_CF.
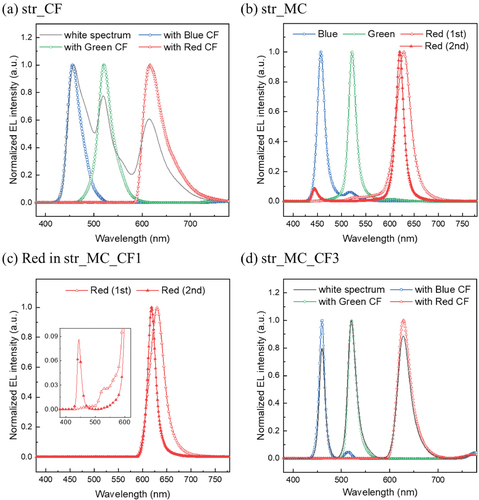
Table 1. CIE color coordinate and color gamut according to OLED structures.
Figure 3. CIE color coordinates of fabricated OLED devices.
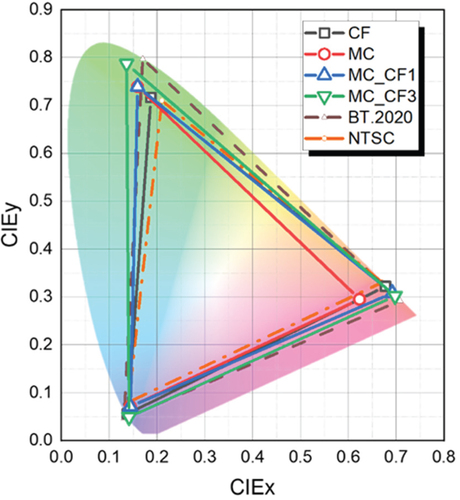
Table 2. Current efficiency according to OLED structures at a current density of 5 mA/cm2.
Figure 4. Electroluminescent spectrum of red, green, and blue emission in tandem OLEDs with a structure of (a) str_MC_CF1 and (b) str_MC_CF3.
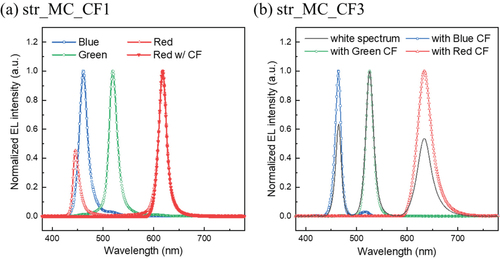
Table 3. CIE color coordinate, color gamut, and current efficiency of tandem OLEDs with a structure of str_MC_CF1 and str_MC_CF3.