Figures & data
Figure 1. (a) RV curve under different cell gap for cholesteric liquid crystal mixture (E7 CLC with 5% RM257) with polymerization temperature fixed at 25°C. (b) RV curve with varying concentrations of polymer monomer (RM257) for cholesteric liquid crystal (E7 CLC) with polymerization temperature fixed at 25°C.
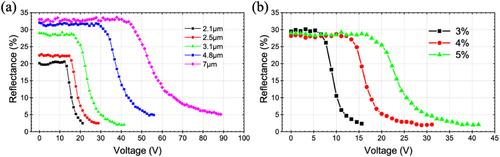
Figure 2. (a) RV curve at various polymerization temperatures for cholesteric liquid crystal (E7 CLC) mixed with 3% polymer monomer (RM257). (b) RV Curve at 25°C for cholesteric liquid crystal (E7 CLC) with varying concentration ratios of polymer monomers RM257 and M1.
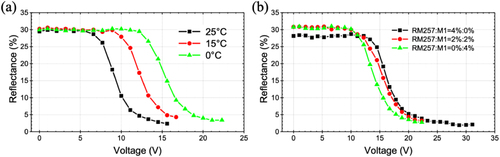
Figure 3. (a) RV curve at 25°C for cholesteric liquid crystal (E7 CLC and HTG CLC) with 4% polymer monomers RM257 and M1. (b) RV curve at different polymerization temperatures for cholesteric liquid crystal (HTG CLC) with 4% polymer monomer M1.
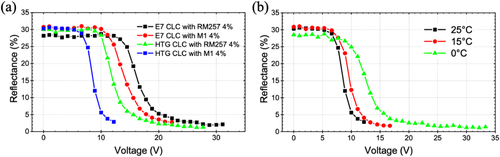
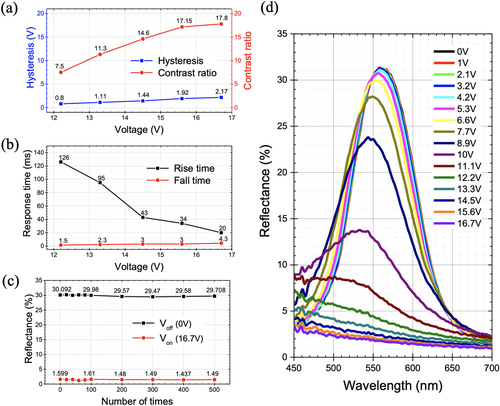
Figure 4. Cholesteric liquid crystal with HTG as the host, polymerized at 15°C, and mixed with 4% M1. (a) Hysteresis and bright-dark state contrast ratio, (b) response time, (c) number of repeated voltage applications, and (d) reflective spectrum at different voltages.