Figures & data
Figure 1. (a) Illustration of the driver’s and co-driver’s viewing angles for the SPM display studied in this paper. θ and ϕ are the polar and azimuthal incident angles of light. (b) is an optical structure of the SPM display panel. TP, MP, and BP indicate the top, middle, and bottom polarizers, respectively. and
are the polar and azimuthal pre-tilt angles of the liquid crystal, respectively.
is the slow axis of the retarder.
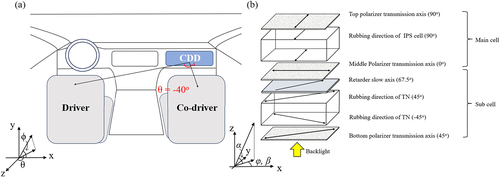
Table 1. Simulation parameters used in the study.
Figure 2. (a) TR vs. polar viewing angle of the O-mode TN display panel with PD HWP. This TR profile was obtained along the horizontal viewing direction. (b) specifies the polarization state change of incident light after passing through BP, TN, and HWP on the Poincaré sphere at 0 V state. Techwiz 2D was used for the calculation in (a), while Techwiz Polar was used for the Poincaré notation of the polarization state evolution.
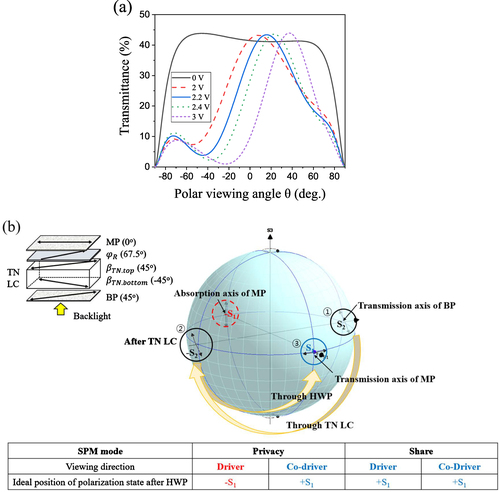
Figure 3. Contour plots of TR in privacy mode when (a) PD and (b) ND HWP were used. (c) and (d) correspond to TR profiles in share mode. Techwiz 2D was used for this calculation.
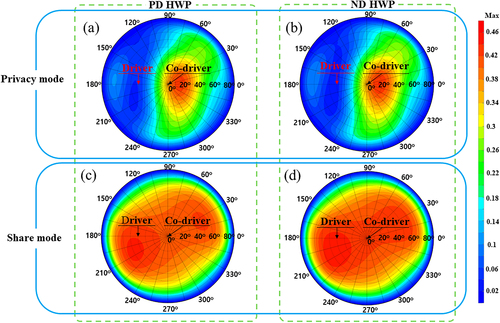
Figure 4. Poincaré plot of the polarization state after passing through ND HWP at the (a) driver’s and (b) co-driver’s viewing directions in privacy mode with 2.2 V applied. is 60o in this example. (c) shows the distance
from the polarization state to the – S1 axis vs.
at the driver’s viewing direction in privacy mode, and (d) reflects the distance
from the polarization state to the + S1 axis vs.
at the co-driver viewing direction in privacy mode. (e–f) correspond to the distance
from the final polarization state to the + S1 axis in share mode with 0 V applied. The numbers in the graphs correspond to the averaged TR value for RGB light. Techwiz Polar was used for this calculation.
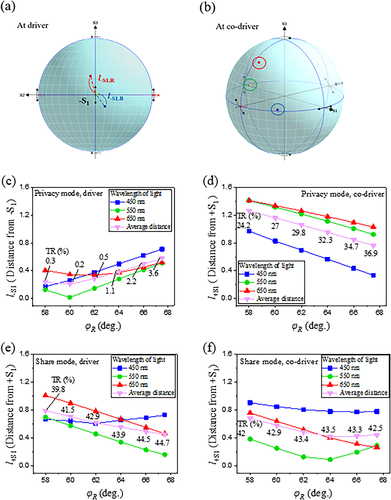
Figure 5. Poincaré plot of the polarization state after ND HWP at the (a) driver’s and (b) co-driver’s viewing directions in privacy mode with 2.2 V applied. (c) represents vs. dRin/dλ of HWP at the driver’s viewing direction in privacy mode, and (d) displays
vs. dRin/dλ of HWP at the co-driver’s viewing direction in privacy mode. (e–f) correspond to
in share mode with 0 V applied. The numbers in the graphs correspond to the averaged TR value for RGB light. Techwiz Polar was used for this calculation.
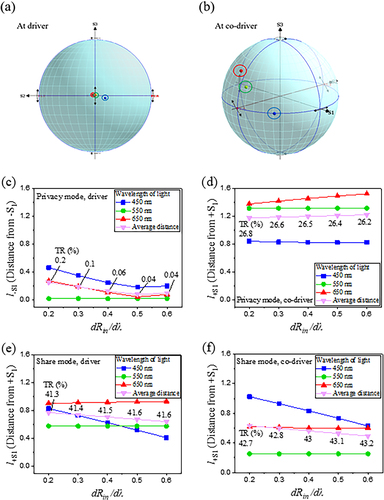
Figure 6. Poincaré plot of the polarization state after ND HWP at the (a) driver’s and (b) co-driver’s viewing directions in privacy mode with 2.2 V applied. (c) presents vs. NZ coefficient of HWP at the driver’s viewing direction in privacy mode, and (d) portrays
vs. NZ coefficient of HWP at the co-driver’s viewing direction in privacy mode. (e–f) correspond to
in share mode with 0 V applied. The numbers in the graphs correspond to the averaged TR value for RGB light. Techwiz Polar was used for this calculation.
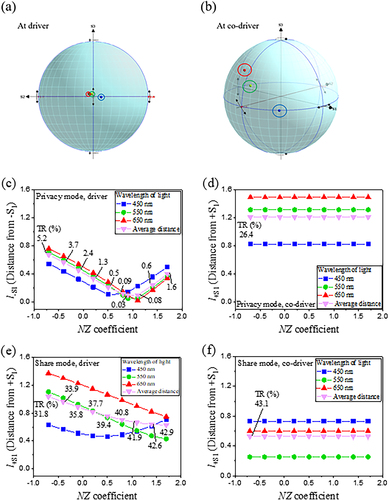
Figure 7. TR vs. polar viewing angle of a display panel along the horizontal viewing direction when the optimized HWP was used and the contour plots of TR in the (b) privacy mode and the (c) share mode when the optimized HWP was used. Techwiz 2D was used for this calculation.
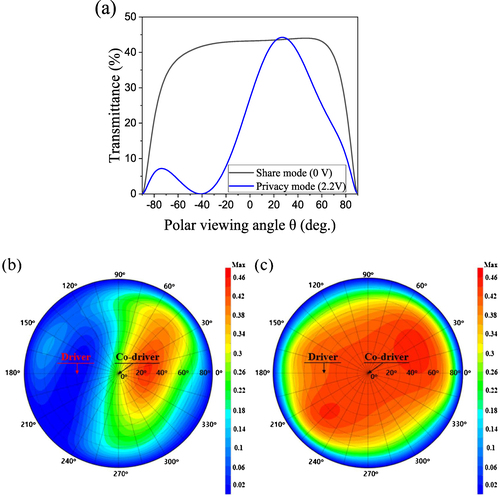
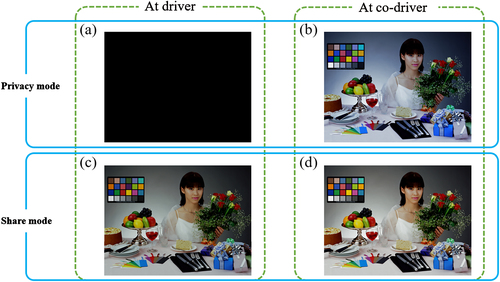
Figure 8. Demonstration simulation images observed at the (a) driver’s and (b) co-driver’s viewing directions in privacy mode. (c) and (d) are the corresponding images in share mode. The simulation parameters for the TN-LCD panel and the compensation film are identical to Figure . Techwiz 2D was used for this calculation.