
Figures & data
Figure 1. RCNN-based segmentation.
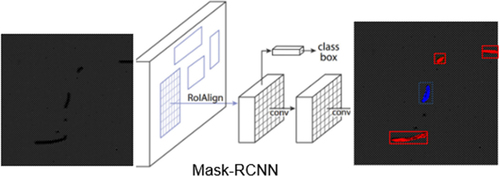
Figure 2. (a) Artificial defect source image example; (b) Output device and (c) Camera sensors and mounts; (d) Acquired raw image (14,192 × 10,640).
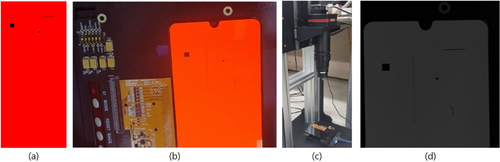
Figure 3. Example of a defined defect classification; (a) Open (b) Line out (c) Short (d) Foreign bodies.
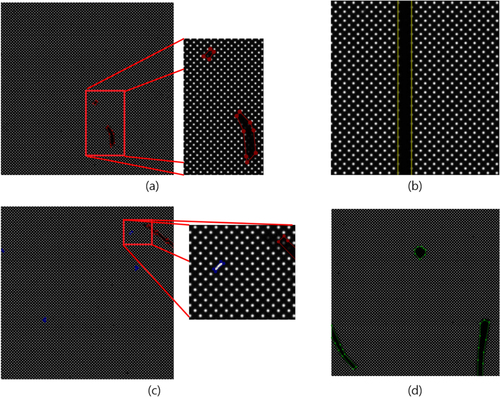
Figure 4. Result of the defect detection, row 1 is the 1024 × 1024 output data and row 2 is the zoomed-in image.
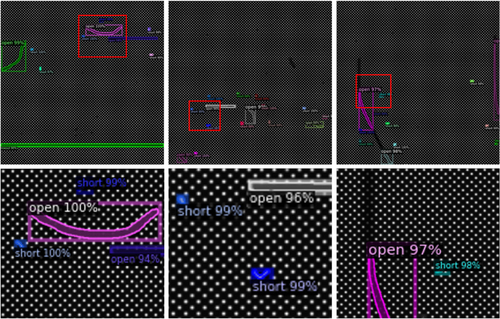
Table 1. Detection rate by defined defect type.
Figure 5. Source data on the left, diffusion model on the right 3 images, OLED pattern information lost as the network process.
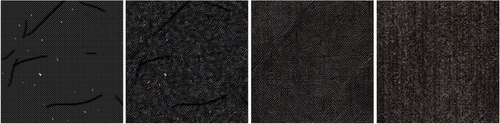
Figure 6. Generate OLED panel unclassified defect images with a partial diffusion model.
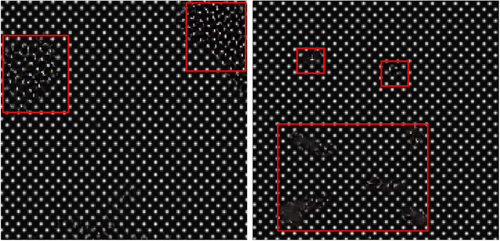
Table 2. Detecting unclassified defects in partial application models of diffusion models.