1,082
Views
17
CrossRef citations to date
0
Altmetric
Research Article

The changing relationship between the convection over the western Tibetan Plateau and the sea surface temperature in the northern Bay of Bengal

&
Pages 1-9 | Received 22 Jun 2017, Accepted 08 Feb 2018, Published online: 27 Feb 2018

Figures & data

Fig. 1. BOB SST (in °C) averaged over JA for (a) PRE99 (b) POST99. (c) The difference between (a) and (b). The regions enclosed in black contours are significantly different from zero at a 99% confidence level.

Fig. 1. BOB SST (in °C) averaged over JA for (a) PRE99 (b) POST99. (c) The difference between (a) and (b). The regions enclosed in black contours are significantly different from zero at a 99% confidence level.

Fig. 2. (a) Time series plot (solid lines) and linear trend (dashed line) of the NBOB SST (in °C) during JA of PRE99 (daily data from 1988 to 1998) (b) Time series (solid lines) and linear trend (dashed line) of the NBOB SST during JA of POST99 (daily data from 1999 to 2009). The linear trends are statistically significant at a 99% confidence level.
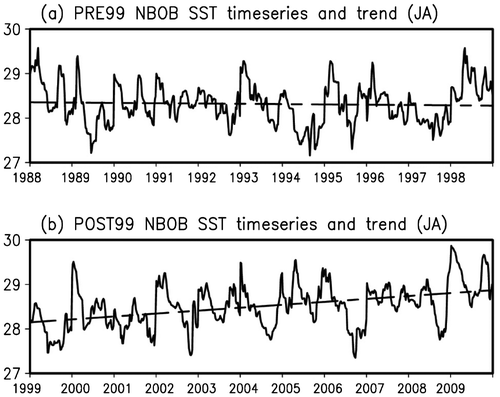
Fig. 2. (a) Time series plot (solid lines) and linear trend (dashed line) of the NBOB SST (in °C) during JA of PRE99 (daily data from 1988 to 1998) (b) Time series (solid lines) and linear trend (dashed line) of the NBOB SST during JA of POST99 (daily data from 1999 to 2009). The linear trends are statistically significant at a 99% confidence level.

Fig. 3. (a)–(f) Wind vector (in m/s) at 400mb, 500mb and 850mb regressed onto the JA NBOB SST daily series for PRE99 (left panel) and POST99 (right panel). Regression coefficient is statistically significant at a 99% level. (g) and (h) are the vertical differences of the regressed wind vectors (200 mb wind minus 850 mb wind) for PRE99 and POST99, respectively. Shown are regressed wind vectors on a 1° × 1° latitude–longitude grid.
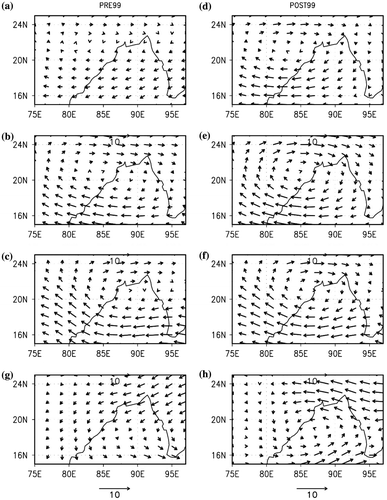
Fig. 3. (a)–(f) Wind vector (in m/s) at 400mb, 500mb and 850mb regressed onto the JA NBOB SST daily series for PRE99 (left panel) and POST99 (right panel). Regression coefficient is statistically significant at a 99% level. (g) and (h) are the vertical differences of the regressed wind vectors (200 mb wind minus 850 mb wind) for PRE99 and POST99, respectively. Shown are regressed wind vectors on a 1° × 1° latitude–longitude grid.

Fig. 4. Moisture flux vector (in kg/m/s) regressed onto the JA NBOB SST for PRE99 (left panel) and POST99 (right panel). The regression coefficient is statistically significant at a 99% level. Shown are the regressed moisture flux vectors on a 1° × 1° latitude–longitude grid.
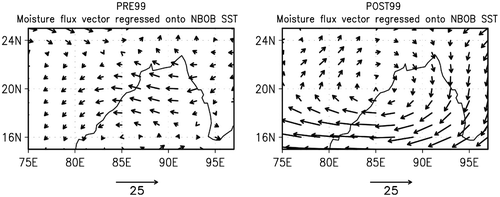
Fig. 4. Moisture flux vector (in kg/m/s) regressed onto the JA NBOB SST for PRE99 (left panel) and POST99 (right panel). The regression coefficient is statistically significant at a 99% level. Shown are the regressed moisture flux vectors on a 1° × 1° latitude–longitude grid.

Fig. 5. (a) The causality (information flow) from the NBOB SST to OLR during PRE99. (b) Same as (a), but for POST99. (c) Same as (a) but for precipitation. (d) Same as (b) but for precipitation. The numbers are significant at a 95% level. The dashed line marks the 3000 m topographic contour. In the figures, the units are nats/day. Nat and bit are two common units for information and entropy, which has the form of logρ (ρ is the probability density function) followed by a mathematical expectation. If the logarithm uses a base 2, then the unit is bit; if it uses a base e, then the unit is nat.
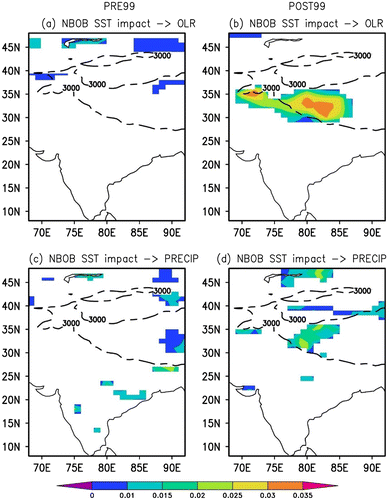
Fig. 5. (a) The causality (information flow) from the NBOB SST to OLR during PRE99. (b) Same as (a), but for POST99. (c) Same as (a) but for precipitation. (d) Same as (b) but for precipitation. The numbers are significant at a 95% level. The dashed line marks the 3000 m topographic contour. In the figures, the units are nats/day. Nat and bit are two common units for information and entropy, which has the form of logρ (ρ is the probability density function) followed by a mathematical expectation. If the logarithm uses a base 2, then the unit is bit; if it uses a base e, then the unit is nat.

Fig. 6. Wind vector (arrow; units in m/s) and geopotential height (shaded; units in m) at 200mb regressed onto the JA NBOB SST for PRE99 (left panel) and POST99 (right panel). The regression coefficients are statistically significant at a 99% level. Shown are the regressed wind vectors and geopotential height on a 1° × 1° latitude–longitude grid. The dashed line marks the 3000 m topographic contour.
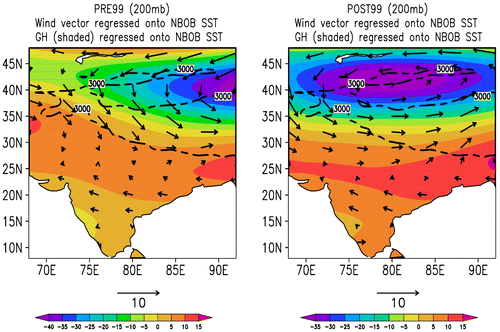
Fig. 6. Wind vector (arrow; units in m/s) and geopotential height (shaded; units in m) at 200mb regressed onto the JA NBOB SST for PRE99 (left panel) and POST99 (right panel). The regression coefficients are statistically significant at a 99% level. Shown are the regressed wind vectors and geopotential height on a 1° × 1° latitude–longitude grid. The dashed line marks the 3000 m topographic contour.

Fig. 7. The longitudinally averaged (75oE – 90oE) wind vector (arrow; units in m/s) and wind magnitude (shaded; units in m/s) at different pressure levels regressed onto the JA NBOB SST for PRE99 (left panel) and POST99 (right panel). The regression coefficients are statistically significant at a 99% level based on the student’s test. Shown are regressed wind vectors on a 1° × 1° latitude–longitude grid.
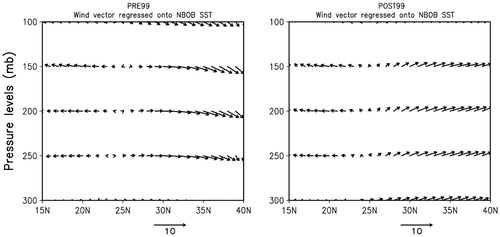
Fig. 7. The longitudinally averaged (75oE – 90oE) wind vector (arrow; units in m/s) and wind magnitude (shaded; units in m/s) at different pressure levels regressed onto the JA NBOB SST for PRE99 (left panel) and POST99 (right panel). The regression coefficients are statistically significant at a 99% level based on the student’s test. Shown are regressed wind vectors on a 1° × 1° latitude–longitude grid.

Fig. 8. (a) The air temperature (in K) at 100mb regressed onto the JA NBOB SST for PRE99. (b) Same as (a) but for 300mb. (c) Similar as (a) but for POST99. (d) Similar as (b) but for POST99. The regression coefficients are statistically significant at a 99% level. Shown is regressed air temperature on a 1° × 1° latitude–longitude grid. The dashed line marks the 3000 m topographic contour.
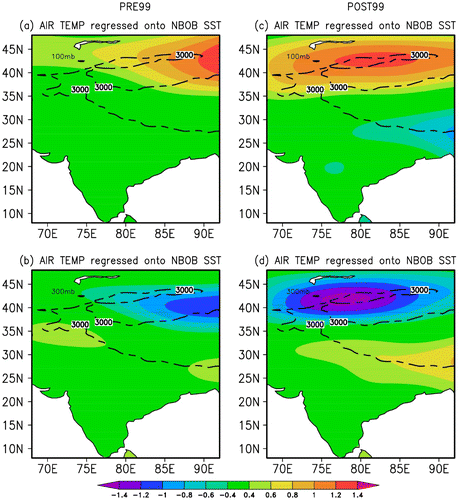
Fig. 8. (a) The air temperature (in K) at 100mb regressed onto the JA NBOB SST for PRE99. (b) Same as (a) but for 300mb. (c) Similar as (a) but for POST99. (d) Similar as (b) but for POST99. The regression coefficients are statistically significant at a 99% level. Shown is regressed air temperature on a 1° × 1° latitude–longitude grid. The dashed line marks the 3000 m topographic contour.