Figures & data
Fig. 1. The track of Typhoon Megi (black curve) and the locations of the two subsurface buoys (black triangles) to the left (LSB) and right (RSB) sides of the storm track.
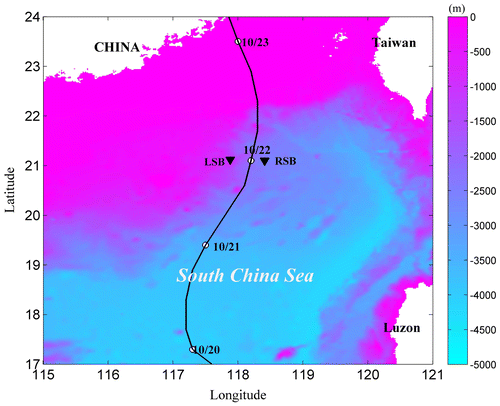
Fig. 2. Sea surface temperature (SST) (a) and the temperature profile (b) varying with time observed at the right side subsurface buoy (RSB). Here, the SSTs between 10/20 and 10/23 are shown in a). The SST for the RSB was read based on the location of the subsurface buoys and it is shown as a top band in b).
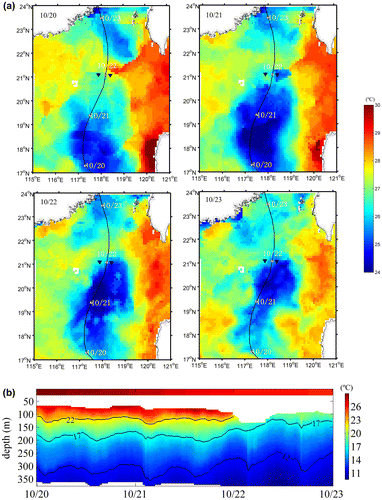
Fig. 3. Ocean current profiles of the eastward and northward components varying with time at the left side subsurface buoy (LSB) and right side subsurface buoy (RSB).
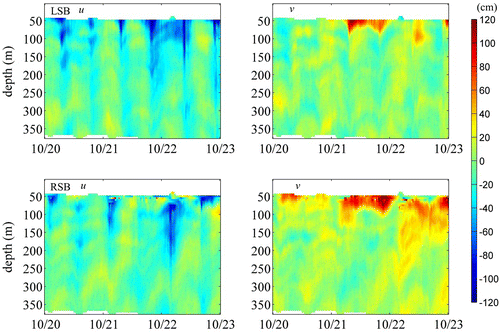
Fig. 4. Contour of the eastward and northward components of the tides (a) and currents after removing tides vs. depth and time (b).
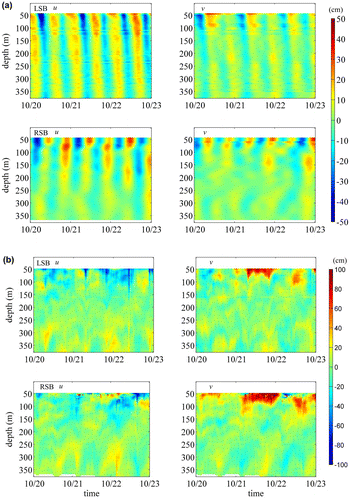
Fig. 5. Current profiles for the numerical experiment. From top to bottom, the information in target current profiles (TCPs) is discarded above depths of 20, 40, 60 and 80 m, respectively. The numbers in the horizontal coordinate show the results at different moments of given TCPs. The solid, dashed and dotted curves are denoted as the TCPs, first simulated current profiles (SCPs) and final SCPs, respectively. The solid arrows and dashed arrows in the upper part of the subfigures are the “observed” and simulated wind stresses.
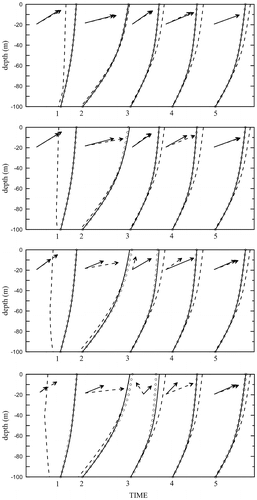
Fig. 6. Depth of mixed layer at the right-side subsurface buoy (RSB) vs. time (UTC) on Oct. 21.
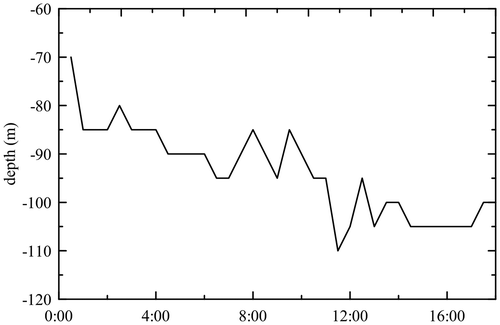
Fig. 7. The wind stresses by the General Ocean Turbulence Model (GOTM) and bulk method vs. time (UTC) at the right side subsurface buoy (RSB).
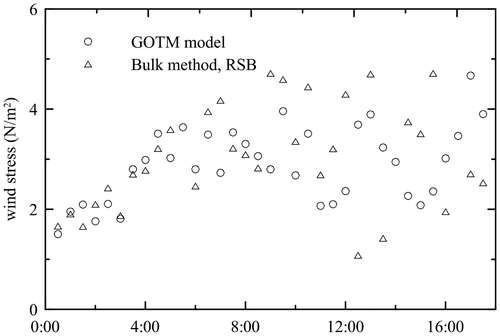
Fig. 8. Logarithm of the amplitude of lateral advection and local acceleration and the Coriolis term vs. time (a), and their ratios integrated between 50 m and 350 m (b).
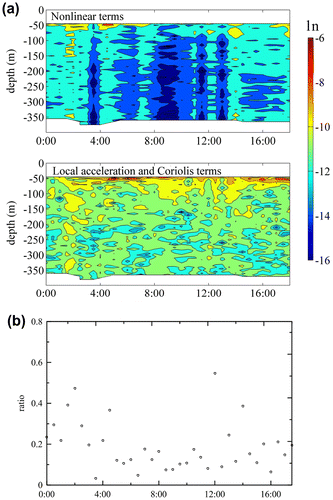
Fig. 9. Wind speeds varying with time from October 20 to October 23 at the right side subsurface buoy (dashed line) and the left side subsurface buoy (solid line).
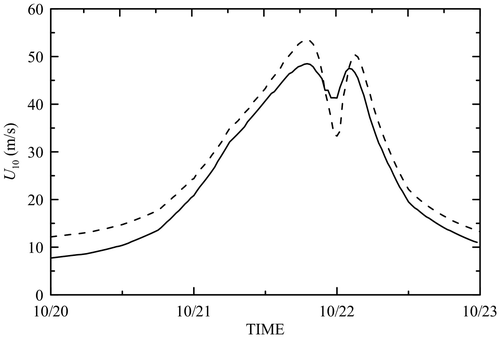
Fig. 10. Comparison of modelled wind speeds (solid line) with those observed by the extreme air–sea interaction (EASI) buoy (circles).
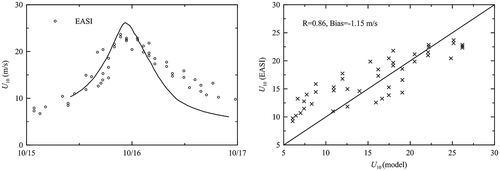
Fig. 11. Drag coefficient vs. wind speed calculated from the General Ocean Turbulence Model (GOTM) and bulk models. Error bars show ± 1 standard deviation from the bin averaged over 2 ms−1.
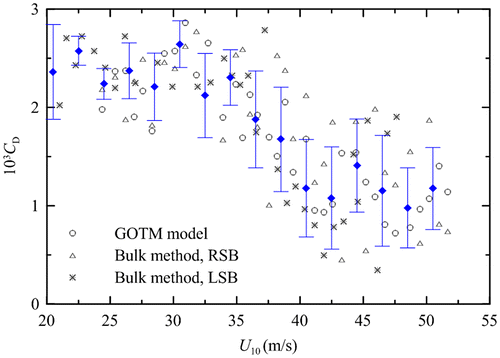
Fig. 12. Parameterisation of the drag coefficients obtained by Powell et al. (2003), Holthuijsen et al. (2012), and Jarosz et al. (2007) corresponding to the resistance coefficient 0.001 cm s−1 and our study denoted by error bars. The shadow shows the uncertainties in the drag coefficient parameterisation due to wind speed.
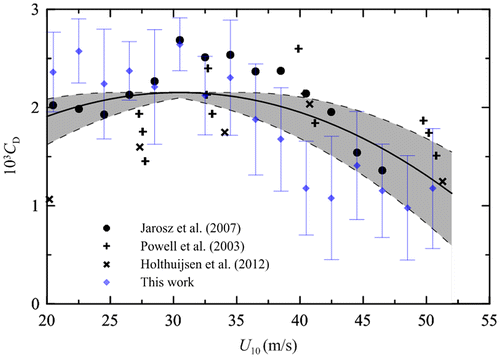
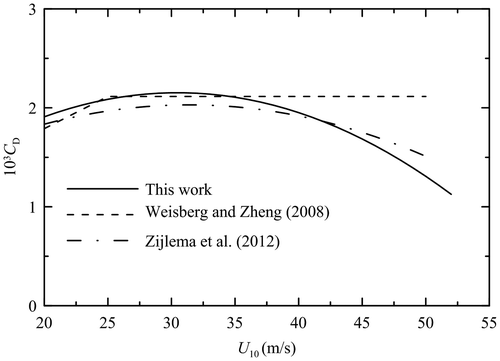
Fig. 13. Comparison of the drag coefficient (CD) parameterisations using Equation (Equation14(14)
(14) ), Weisberg and Zheng (Citation2008) and Zijlema et al. (Citation2012).