
Figures & data
Fig. 1. Map of the area studied presenting the different locations of the Aral Sea shoreline during its recession. The two main tributaries of the lake and other relevant geographical features of the region are also shown. The locations of the meteorological stations used in this study are indicated by their reference number (see ).
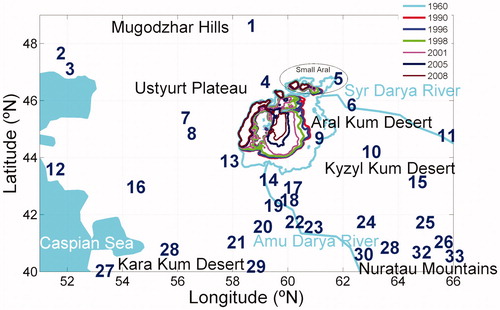
Table 1. Locations of the meteorological stations used in this study.
Fig. 2. Monthly mean of the DTR from 1991 to 2010 at several representative stations. On the plots, large white circles indicate the months in which there were no data and the small different coloured circles indicate the number of missing days in each month: white circles more than 85%, grey circles between 80 and 50%, magenta circles between 50 and 15% and black below 15%.
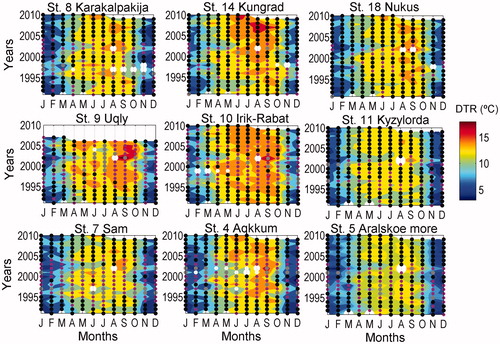
Fig. 3. Averaged seasonal differences of the monthly mean DTR between two consecutive decades starting from 1991. The averaged periods are indicated above each panel.
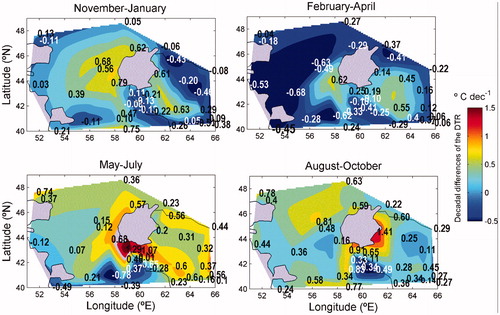
Fig. 4. Differences of the annual mean of the DTR between the two consecutive decades: 1991–2010 and 2001–2010.
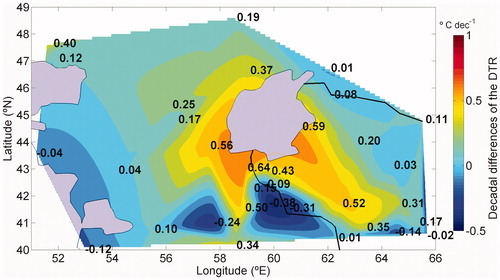
Fig. 5. (a) Decadal differences of the mean temperature (VAR-TEMPmean) and of the minimum and maximum daily temperature (VAR-TEMPdmax, VAR-TEMPdmin). The averaged periods are: November–January (NDJ), February–April (FMA), May–July (MJJ), and August–October (ASO). Numbers are the references of the station represented for each point. At the stations highlighted in yellow, the decadal differences of the mean DTR are negative. (b) Spatial representation of the decadal differences of VAR-TEMPmean for the seasonal periods indicated in each plot.
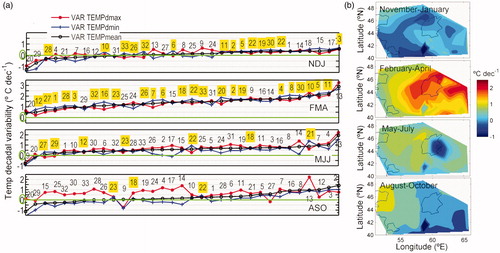
Fig. 6. Mean curves for all the stations from 1991 to 2010 of the monthly averaged DTR and of the monthly mean temperature. The coloured rectangles indicate the natural period for averaging three consecutive months which appears when the DTR and mean temperature curves are considered.
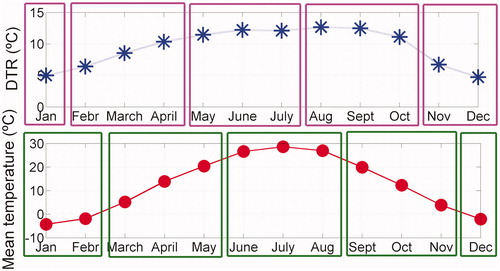
Fig. 7. Decadal differences of the mean annual temperature (VAR TEMPmean) at each station considering two different averaging segmentations based either on the annual cycle of the DTR (NDJ, FMA, MJJ, ASO) or on the annual cycle of the mean temperature (DJF, MAM, JJA, SON).
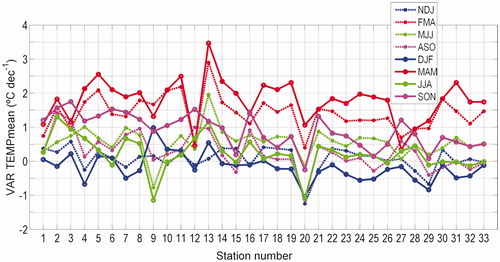
Table 2. Main conclusions about the decadal variation (between 1990 and 2010) of the monthly mean of DTR in the studied region (considering the stations available) on annual and seasonal time-scales.