Figures & data
Fig. 1. Panels a, b, c are PDSI composites for strong El Ninos (15 events from Dai et al's PDSI for 1900–2014 C.E) for the seasons indicated; panel d is OWDA's PDSI composite for exactly the same events. Panels e, f, g are PDSI composites for extreme El Ninos (three events: 1972/73, 1982/83, 1997/98); panel h is OWDA's PDSI composite for exactly the same events. El Nino events selected are the same as Brönnimann et al. (Citation2007) for the instrumental period and excluding events following volcanic eruptions or extreme El Ninos. Grid points with at least 95% statistical significance are indicated with white colour hatching.
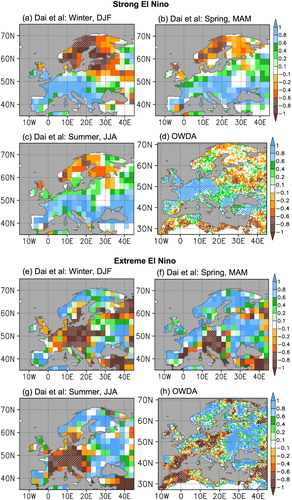
Fig. 2. Composites of PDSI for extreme El Nino years (at or above +2 S.D., 16 events) using OWDA and Li et al. (Citation2011) ENSO index for 900–2002 C.E. Panel a: El Nino leads OWDA by 1 year; panel b: zero lead. See text on interpretation of lead or lag in this study. Grid points with at least 95% statistical significance are indicated with white hatching.
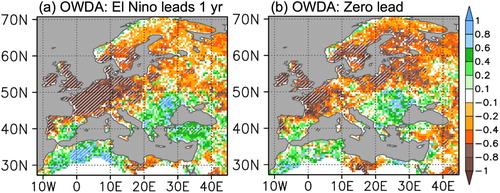
Fig. 3. Comparisons of CESM Last Millennium Experiment (LME) historical experiments (10 members) and Hadley Centre SST for DJF 1899–2003. Panel a is SST bias. Panels b, c are composites of SST anomalies for strong El Nino (+1 to +2 S.D. in Nino 3.4). Panels d, e are composites of SST anomalies for extreme El Nino (1972/73, 1982/83, 1997/98 for Had SST; at or above +2.5 S.D. in Nino 3.4 for LME). Colour shading also indicates 95% statistical significance. CI is contour interval.
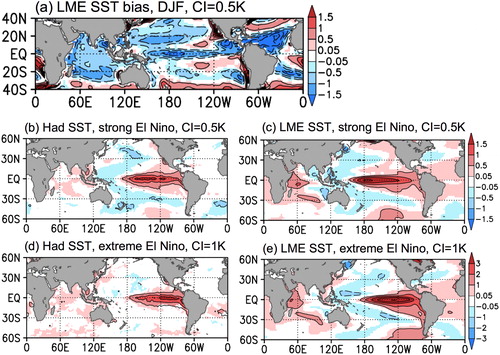
Fig. 4. Composites of PDSI in the seasons indicated for strong El Nino (left column; +1 to +2 S.D. in Nino3.4, 984 events) and for extreme El Nino years (right column; at or above +2.5 S.D. in Nino3.4, 121 events). These use a total of 11,560 years in total from CESM Last Millennium Experiment historical experiments (10 members). Grid points with at least 95% statistical significance are indicated with white hatching.
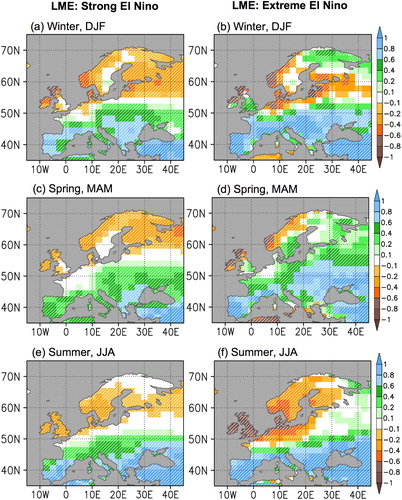
Fig. 5. Composites of sea-level pressure for strong El Ninos (left column; +1 to +2 S.D. in Nino3.4, 984 events) and for extreme El Nino years (right column; at or above +2.5 S.D. in Nino3.4, 121 events) and the seasons indicated (i.e. same as except for SLP). These use a total 11,560 years of CESM Last Millennium Experiment historical experiments (10 members). Contour intervals = 1 hPa (top and middle rows), 0.5 hPa (bottom row). Grey shading indicates at least 95% statistical significance.
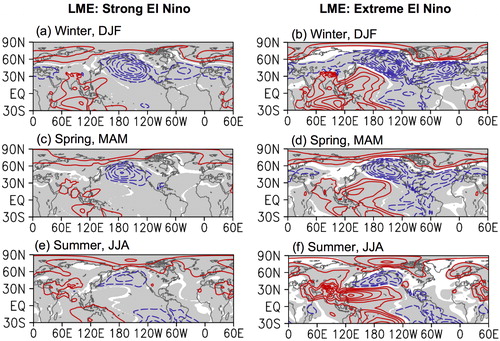
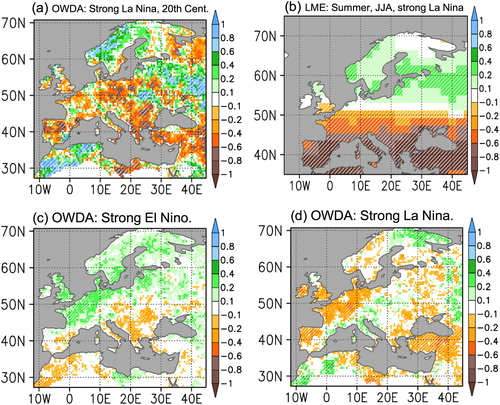
Fig. 6. Panel a is OWDA's PDSI composite for selected strong La Nina events same as Brönnimann et al. (Citation2007) for the instrumental period and excluding events following volcanic eruptions. Panel b is composite of LME's PDSI for strong La Ninas (−1 to −2 S.D. in Nino3.4, 1089 events); these use a total 11,560 years of CESM Last Millennium Experiment historical experiments (10 members). Panels c, d are OWDA's PDSI composites for strong El Nino and La Nina events, respectively (between 1 and 2 S.D.). Grid points with at least 95% statistical significance are indicated with white colour hatching.