Figures & data
Table 1. Information about the study sites situated in the TP region.
Fig. 1. Sensitivity analysis framework for model parameter combinations based on the CNOP-P approach.
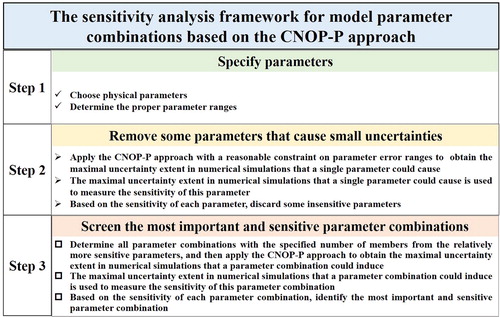
Table 2. The physical parameters and their default, minimum and maximum values for the TP sites in the CoLM. Def = Default value; Min = Minimum value; Max = Maximum Value.
Fig. 2. The reference states of SSM simulated by using the default parameter values (a) as well as the maximal uncertainties in the simulated SSM due to errors from all 28 selected parameters at different TP sites during different simulation periods in terms of absolute changes (b).
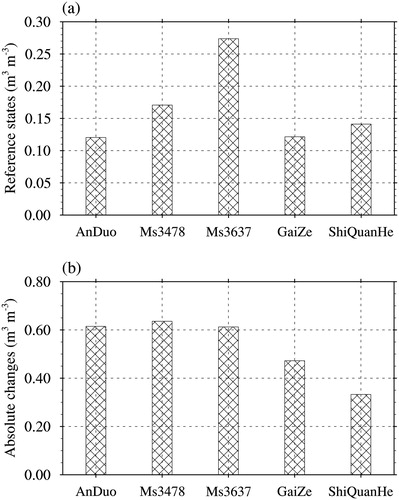
Fig. 3. The variations (left column) in ET (a, mm day−1), Rsur (c, mm day−1) and subsurface soil moisture (e, m3 m−3) relative to their respective reference states (right column) of ET (b, mm day−1), Rsur (d, mm day−1), subsurface soil moisture (f, m3 m−3) caused by the CNOP-P-type parameter errors associated with all 28 parameters at different TP sites during different simulation periods.
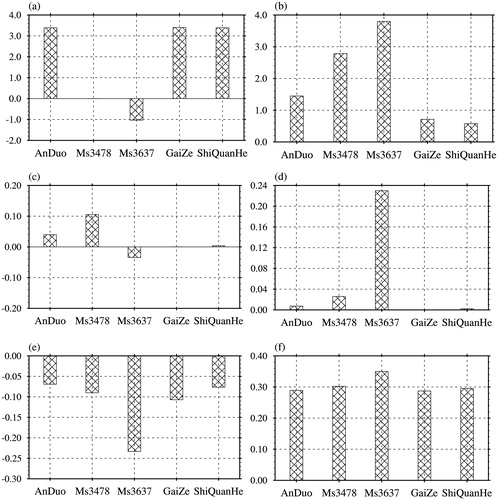
Fig. 4. The sensitivity ranks of all 28 parameters based on the single-parameter sensitivity analyses using the CNOP-P approach (a) and the OAT method (b) at different TP sites. Numbers “1”, “2”, “3”, and “4” on colored boxes label the 4 most sensitive parameters (in order of sensitivity) at each site.
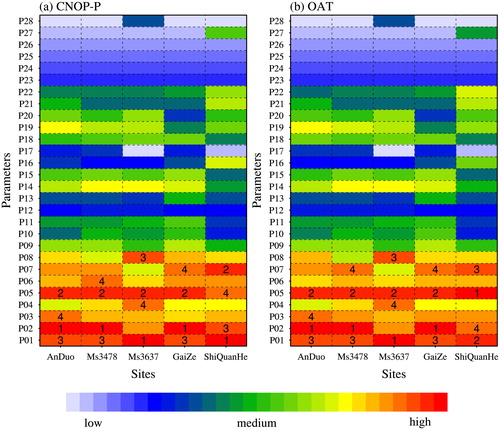
Fig. 5. The maximal uncertainties in the simulated SSM due to errors from the most sensitive and important 4-parameter combinations identified by using the CNOP-P approach as well as errors from the 4 most sensitive parameters determined by using the OAT method: (a) in terms of absolute changes, (b) in terms of percentage changes.
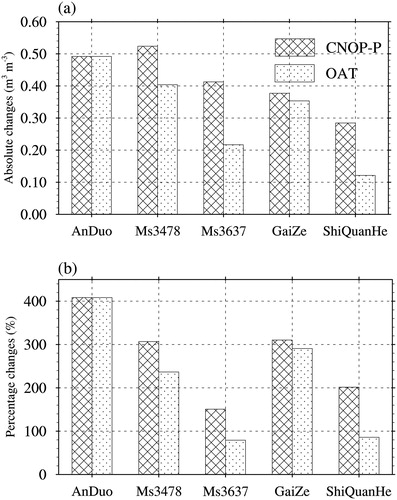
Table 3. The most sensitive parameter combinations at different TP sites identified by using the sensitivity analysis framework based on the CNOP-P approach.
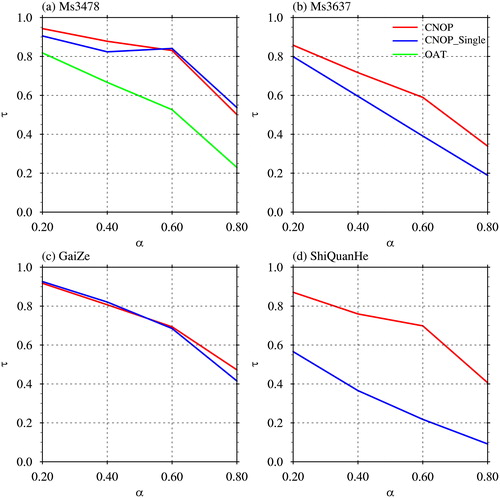
Fig. 6. The reductions in the uncertainties of the simulated SSM at different TP sites, which are represented by caused by the different decreased extents (as indicated by
) of three types of parameter error: CNOP, CNOP_Single, and OAT.