Figures & data
Fig. 1. Location of the ground-based GNSS stations from Morocco network (circles) and IGS network (triangles), plotted over the AROME-Morocco model domain. The background is the model orography (grayscale at the right of the panel; m). The black dots indicate location of the meteorological surface stations. The geographical locations of the two GNSS stations referred in the text are indicated by names. Some additional geographical locations are indicated (sea and mountains). The dashed line delineates the zone of interest of the 1 March 2018 case study.
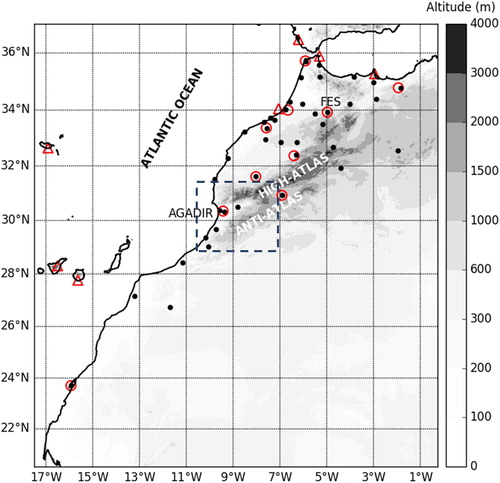
Fig. 2. Scatter plot of AROME-Morocco model background ZTD against observed ZTD for the GNSS receiver site at Fes for 1-month.
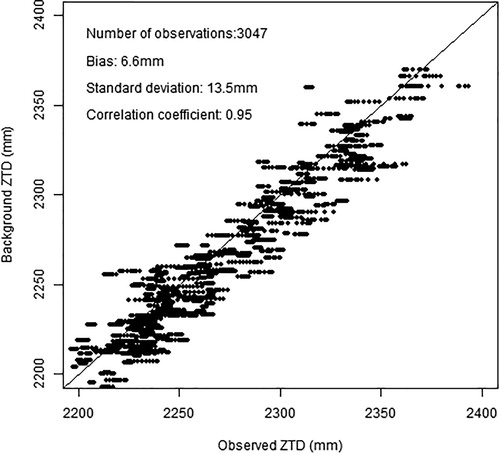
Fig. 3. Vertical cross section along a latitudinal line of analysis increments of specific humidity (g/kg), obtained by assimilating a single ZTD observation at Fes GNSS station for 12 UTC, 26 February 2018.
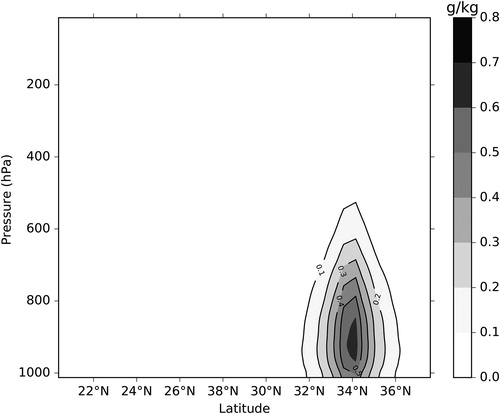
Fig. 4. Mean and Standard deviation errors of background departures for specific humidity from radiosonde observations (in g/kg) computed from 20 February to 20 March 2018 for CTRL and GNSS experiments. The shaded areas represent the 95% confidence intervals.
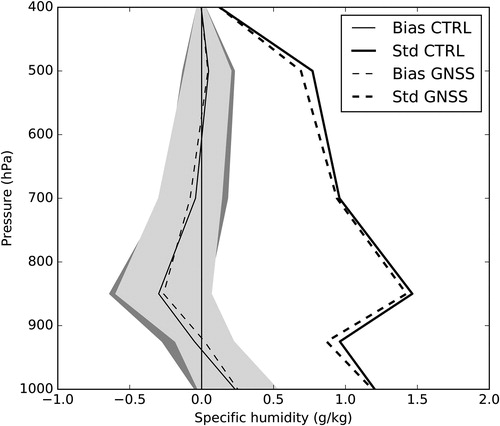
Fig. 5. Bias and standard deviation forecast errors of 2 m relative humidity (%) according to forecast range (hours) for both CTRL and GNSS experiments. The scores are calculated against surface observations shown in for the period from 20 February to 20 March 2018. The error bars represent the 95% confidence intervals.
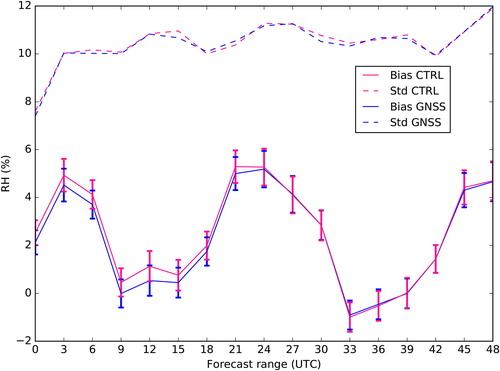
Fig. 6. Quantitative scores against observations (FBIAS, POD, FAR and ETS) for daily precipitation AROME-Morocco forecasts for CTRL (solid line) and GNSS (dashed line) experiments from 20 February to 20 March 2018.
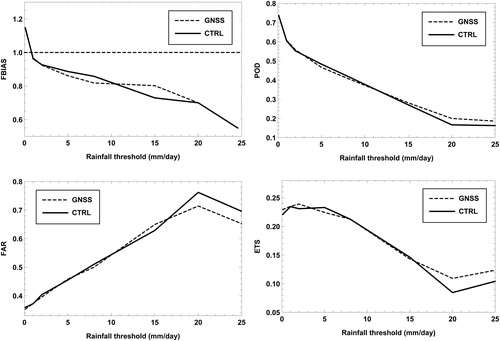
Fig. 7. European Centre for Medium-Range Weather Forecasts (ECMWF) analysis at 00:00 UTC on 1 March 2018: temperature (dashed lines) and geopotential heights (colors) at 500 hPa with mean seal level pressure (solid lines).
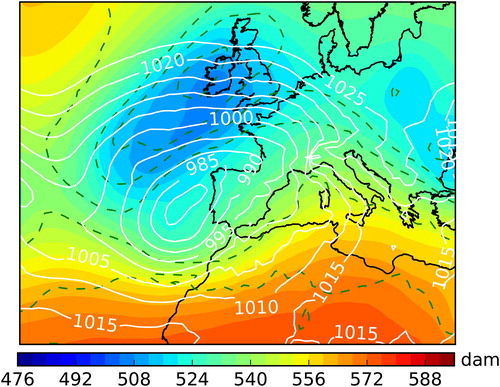
Fig. 8. Maximum of reflectivity from the Agadir radar in dBZ on 1 March 2018 at 07 UTC (a), 12 UTC (b).
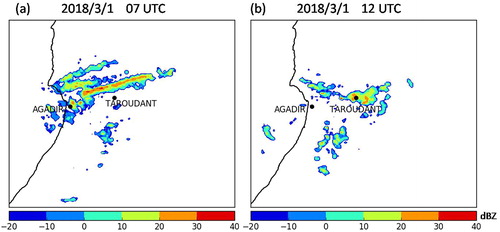
Fig. 9. Twenty-four hours accumulated precipitation in mm from 1 March 2018 06 UTC to 2 March 2018 06 UTC, over Agadir radar coverage area for (a) radar QPE, (b) CTRL experiment and (c) GNSS experiment.
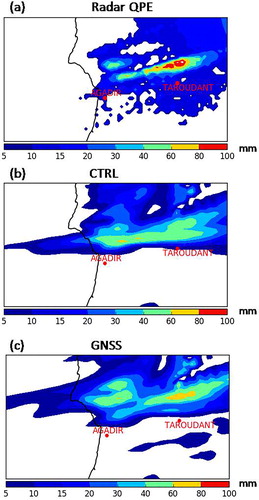
Fig. 10. AROME-Morocco 8-hour forecast range valid at 08 UTC, 1 March 2018 for: integrated water vapour (in mm) from (a) CTRL experiment (b) GNSS experiment.
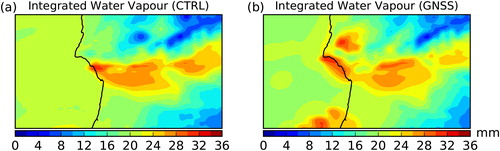
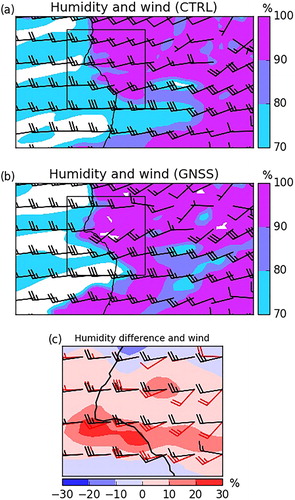
Fig. 11. AROME-Morocco 8-hour forecast range valid at 08 UTC, 1 March 2018 for: 850 hPa relative humidity (in %) and wind vector from (a) CTRL experiment (b) GNSS experiment. Panel (c) shows differences in the 850 hPa relative humidity valid at 08 UTC, 1 March 2018 between CTRL and GNSS (GNSS-CTRL), overlaid with the wind vectors of CTRL (black vectors) and GNSS (red vectors) with a zoom on the area represented by a square in panels (a) and (b).