Figures & data
Table 1. Terms from climate science matched to control system terms.
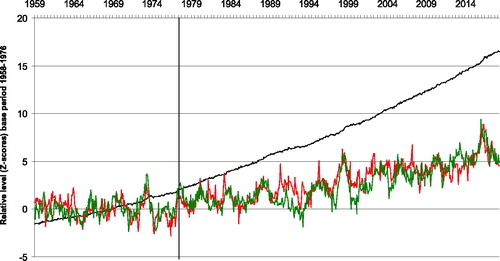
Fig. 1. Monthly data, Z-score base period November1958-December 1976 (period to left of vertical black line). Putative control system model for global surface temperature, selected elements: Disturbance (level of atmospheric CO2) (black curve); control system setpoint for temperature (purple line); observed temperature (red curve).
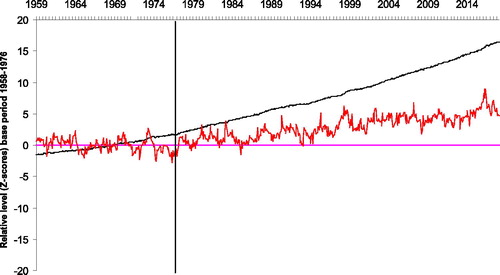
Fig. 2. Monthly data, Z-score base period November 1958 - December 1976 (period to left of vertical black line). Putative control system model for global surface temperature, full set of elements: Disturbance (level of atmospheric CO2) (black curve); control system setpoint for temperature (purple line); observed temperature (red curve); level of control system error (P_error) (green curve); integral (cumulative sum) of control system error (I_error) (orange curve); derivative (first difference) of control system curve (D_error) (brown curve).
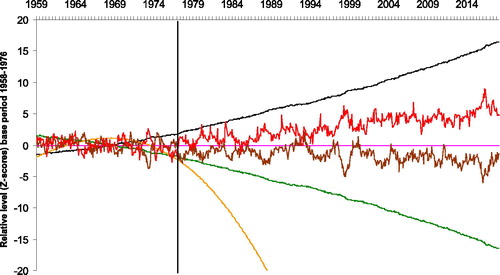
Table 2. Results of ADF tests for stationarity, allowing for both drift and trend.
Table 3. Putative PID control system: ridge regression results.
Table 4. Eviews ARDL estimation output for period November 1958 to February 2018 for temperature as a function of putative control system P_error, I_error and D_error: short-run model dynamic relationship.
Table 5. Eviews ARDL estimation output for period November 1958 to February 2018 for temperature as a function of putative control system P_error, I_error and D_error: short-run model independent variables.
Fig. 3. Fit with observed temperature of global surface temperature predicted from dynamic regression models involving various combinations of control system error terms. The PID model shows the best fit (highest Coefficient of Determination (R-squared) and lowest Akaike Information Criterion).
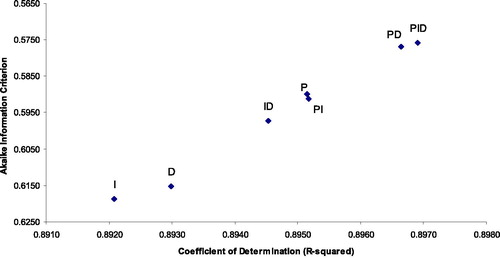
Table 6. Fit with observed temperature of global surface temperature predicted from dynamic regression models involving various combinations of control system error terms.
Fig. 4. Monthly data, Z-score base period November 1958 - December 1976 (period to left of vertical black line). Predicted temperature from dynamic regression model of a control system for global surface temperature using P, I and D error terms (green curve); Disturbance to temperature (level of atmospheric CO2) (black curve); observed temperature (red curve).