Figures & data
Fig. 1. The top and third panels are the northern hemispheric distributions above 20°N of the values of ACF for boreal winter and summer. The second and fourth panels are the corresponding results for the confidence interval. Based on ECMWF monthly mean data of ERA-20C (1900–2010).
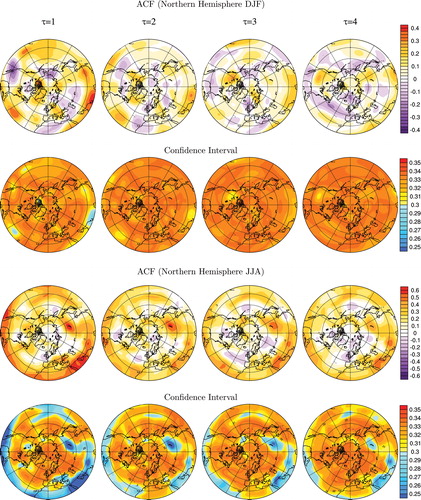
Fig. 2. FA calculated susing the 500 hPa geopotential height for global, tropical, and north/south hemisphere means. Three time series are considered for annual, DJF, and JJA means. Based on ECMWF monthly mean data of ERA-20C (1900–2010). τ is in unit of year. The black lines are the results of H = 0.5.
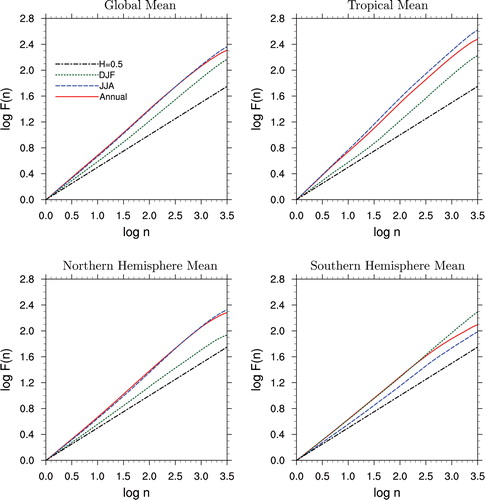
Fig. 3. Top panel, the annual mean distribution of the critical exponents H of FA using the 500 hPa geopotential heights; bottom panel, the distribution of the standard deviation.
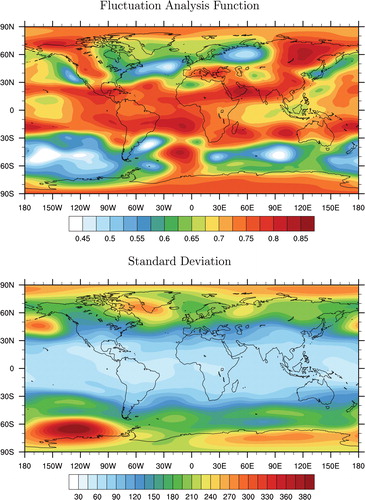
Fig. 4. Upper left and right plots are the northern hemispheric distributions above 20°N of H for the boreal winter and summer. Lower left and right plots are the southern hemispheric distributions below 20°S of H for the austral winter and summer.
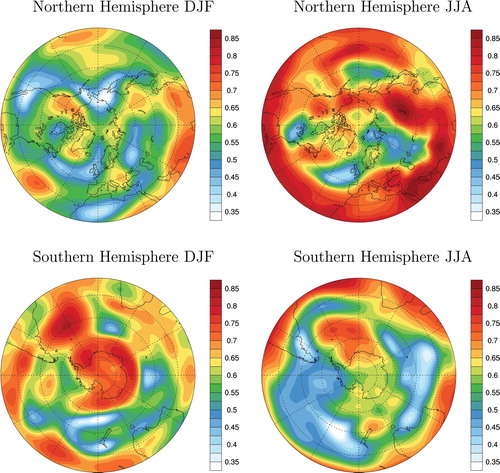
Fig. 5. Global distributions of the characteristic time for the six mmax values (5, 10, 15, 20, 25, and 30 years). Based on ECMWF monthly mean data of ERA-20C (1900–2010).
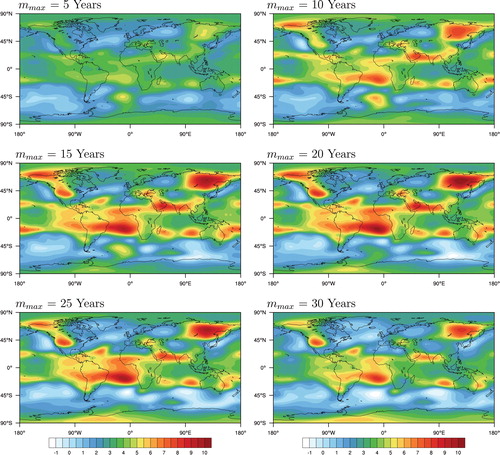
Fig. 6. Upper left plot shows the distributions above 20°N of the characteristic time in the DJF Northern Hemisphere above 20°N; the upper right panel is the same but for JJA northern hemisphere. mmax = 25 years. The lower panel shows the results for Southern Hemisphere.
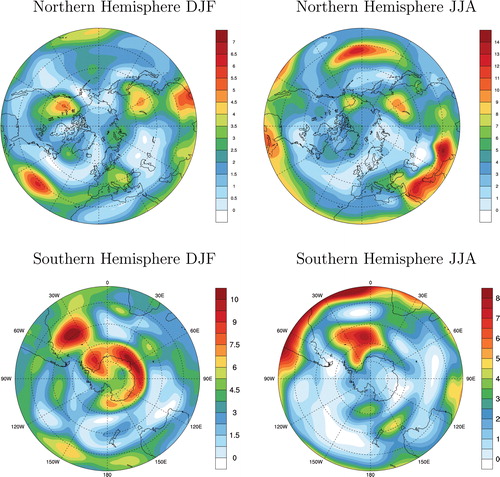
Fig. 7. The top left panel shows the results of ACF for global mean (red), tropical mean (green), northern hemispheric mean (blue) and southern hemispheric mean (purple) of monthly mean geopotential height at 500 hPa from January 1900 to December 2010, τ is in the unit of the year; the top left is the results of daily mean geopotential height at 500 hPa from 1 January 1979 to 31 December 2016, τ is in the unit of the day. The bottom panels show the corresponding results of FA.
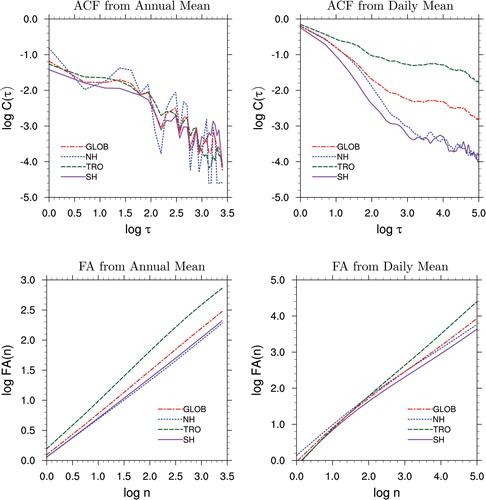
Fig. A1. The FA calculated using the surrogate time series for global, tropical, and north/south hemisphere means. Three time series are considered for annual, DJF, and JJA means. Based on ECMWF monthly mean data of ERA-20C (1900–2010). τ is in unit of year.
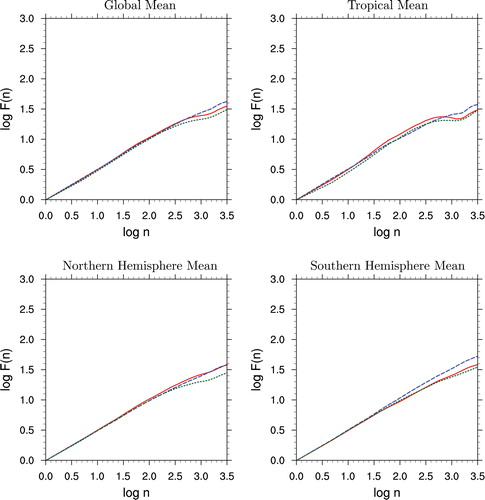
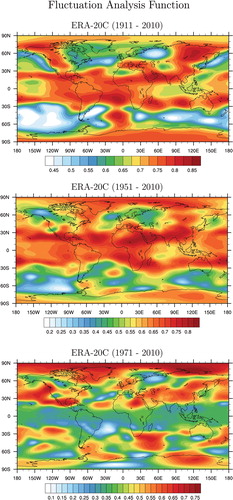
Fig. A2. Annual mean distribution of the critical exponents H of FA using the data of EAR-20C in periods of 1911–2010, 1951–2010, and 1971–2010.