Figures & data
Fig. 1. The definition of central eastern China area (25°-35°N, 110°-120°E).
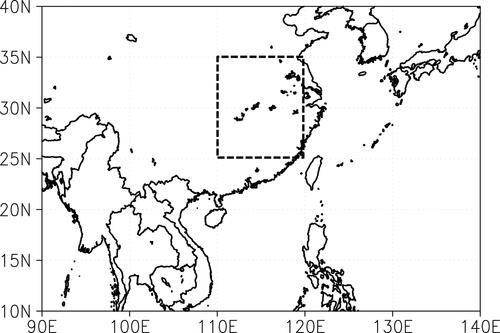
Fig. 2. Time series of central eastern China rainfall in summer (June to August).
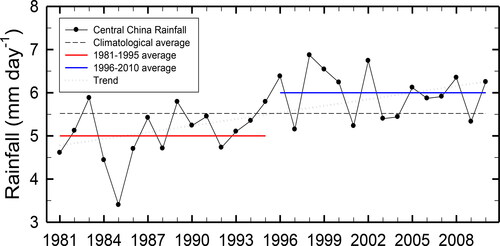
Fig. 3. Differences in (a) outgoing longwave radiation (OLR) and (b) rainfall between Epoch II and Epoch I.
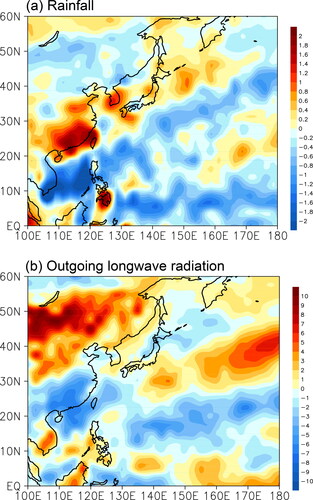
Fig. 4. Time series of (a) central eastern China rainfall (solid line with a closed circle) and western North Pacific monsoon index (WNPMI) (dotted line with an open circle) and (b) central eastern China rainfall (solid line with a closed circle) and East Asian summer monsoon index (EASMI) (dotted line with an open circle) in summer (June to August).
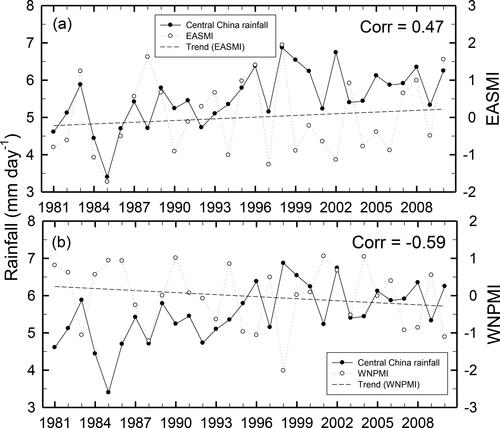
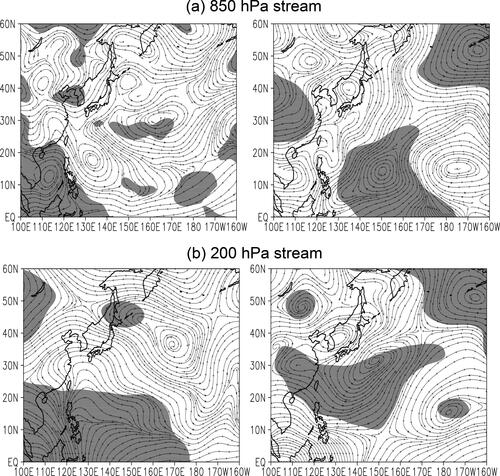
Fig. 5. Same as in , but for (a) 850 hPa stream functions and (b) 200 hPa stream functions. Shaded areas are significant at the 95% confidence level.
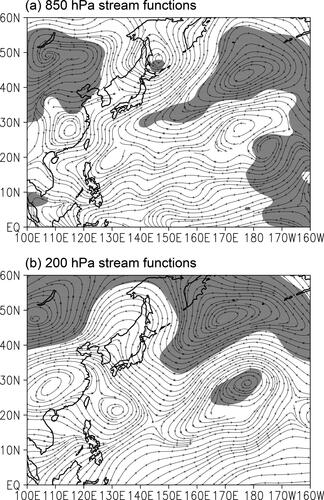
Fig. 6. Western North Pacific subtropical highs (WNPSHs) in Epoch II (solid line) and Epoch I (dashed line).
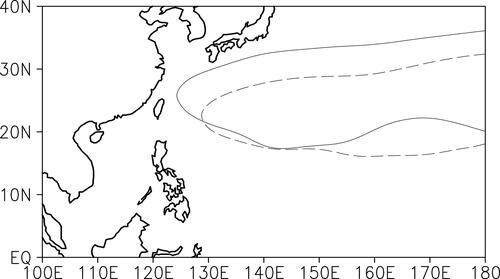
Fig. 7. Same as in , but for (a) 850 hPa horizontal divergence and (b) 200 hPa horizontal divergence. Shaded areas are significant at the 95% confidence level. Contour interval is 2 s−1*107 for 850 hPa horizontal divergence and 3 s−1*107 for 200 hPa horizontal divergence.
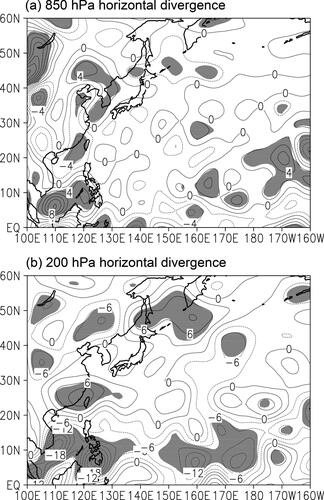
Fig. 8. (a) 200 hPa jet streaks of Epoch II (solid line) and Epoch I (dashed line) and (b) difference in 200 hPa zonal wind between Epoch II and Epoch I. Here, jet streak is an area that zonal wind at 200 hPa is greater than 25 ms−1. In (b), contour interval is 0.5 ms−1 and shaded areas are significant at the 95% confidence level.
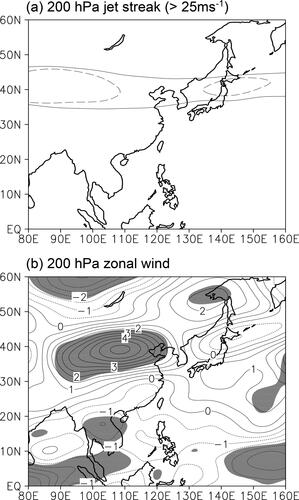
Fig. 9. Composite differences of latitude–pressure cross section of (a) vertical velocity (contours) and meridional circulations (vectors), (b) air temperature, and (c) specific humidity averaged along 110°-120°E between Epoch II and Epoch I in June to August. The values of vertical velocity are multiplied by −100. Bold arrows and shaded areas are significant at the 90% confidence level. Contour intervals are 0.3−2hPa s−1 for vertical velocity, 0.2 °C for air temperature, and 0.1 g kg−1 for specific humidity, respectively.
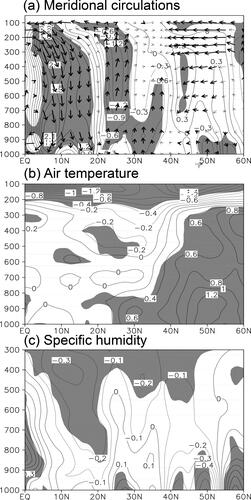
Fig. 10. Time series of central eastern China rainfall (solid line with a closed circle) and western North Pacific TC genesis frequency (dotted line with an open circle) in June to August.
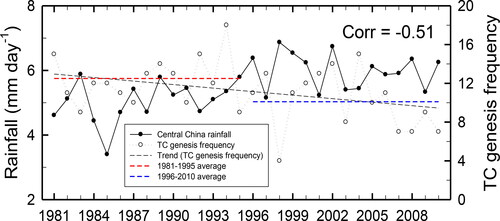
Fig. 11. Difference in TC passage frequency between Epoch II and Epoch I. Small squares inside the circles indicate that the differences are significant at the 95% confidence level.
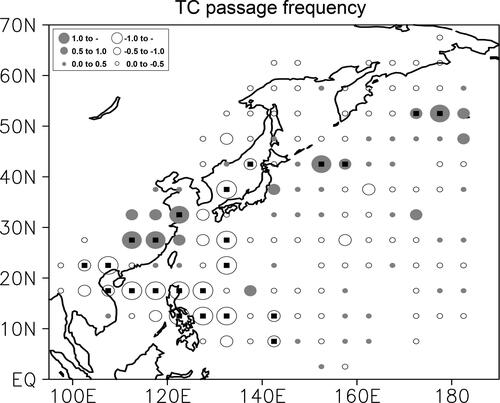
Fig. 12. Time series of central eastern China rainfall (solid line with a closed circle) and Pacific Decadal Oscillation (PDO) index (dotted line with an open circle) (a) in June to August and (b) in December to February.
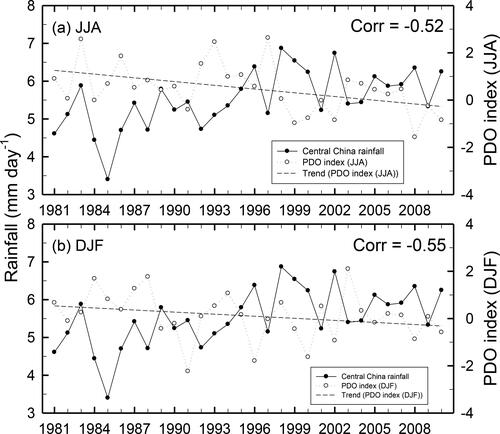
Fig. 13. Same as in , but for (a) 850 hPa stream functions and (b) 200 hPa stream functions. Left and right panels denote the average of December to February (DJF) and the average of March to May (MAM), respectively. Shaded areas are significant at the 95% confidence level.