
Figures & data
Table 1. Summary statistics of the selected stations.
Figure 1. Study area: meteorological stations of Northern Area and KPK (Pakistan).
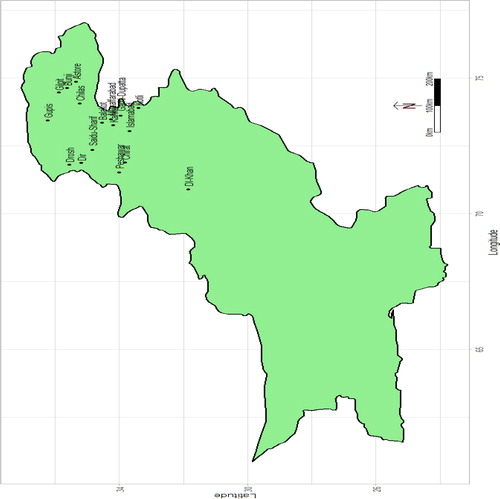
Table 2. Classification criteria SPEI.
Table 3. One step transition probability matrix.
Table 4. Percentage frequencies of drought class.
Table 5. Standardised weights of transition from one state to another stat.
Table 6. Predicted probabilities for the month of December 2017 at Astore.
Table 7. One month ahead forecast probabilities of various drought classes.