Figures & data
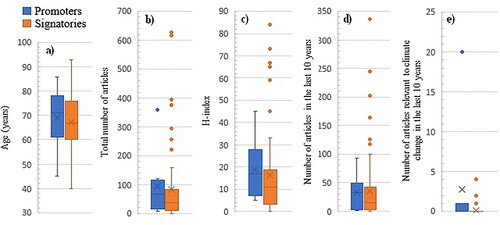
Fig. 1. Demographic and bibliometric data for the Promoters (P, in blue) and Signatories (S, in orange) of the Petition. (a) Age (years); (b) total number of articles per capita; (c) H-index; (d) number of articles in the last 10 years per capita; (e) number of articles relevant to climate change in the last 10 years per capita (see text for details). The box-and-whisker plots show the median, first and third quartile and outliers. Crosses show mean values. In panels (b), (d) and (e), articles authored by several of the promoters or signatories are counted multiple times.