Figures & data
Figure 1. Observed radar reflectivity (unit: dBZ) of the squall line at 0800 UTC (a), 0930 UTC (b), 1130 UTC (c), and 1330 UTC (d) 14 June 2009.
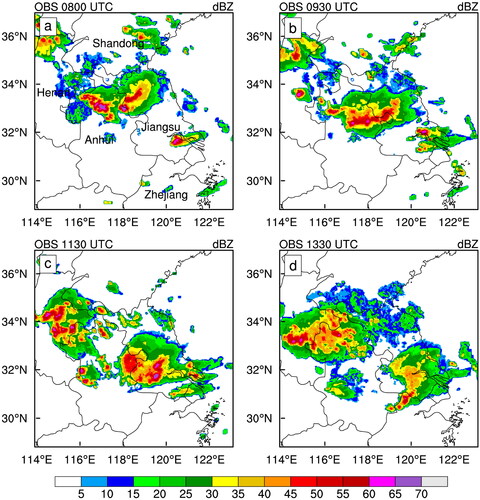
Table 1. List of experiments.
Figure 2. Two model domains (black rectangle) superposed on terrain (unit: m, shaded). The black dots indicates the eight radars including Shangqiu radar (SQRD), Xuzhou radar (XZRD), Lianyungang radar (LYRD), Fuyang radar (FYRD), Yancheng radar (YCRD), Hefei radar (HFRD), Nanjing radar (NJRD), and Nantong radar (NTRD). The circles represent the maximum range of radars.
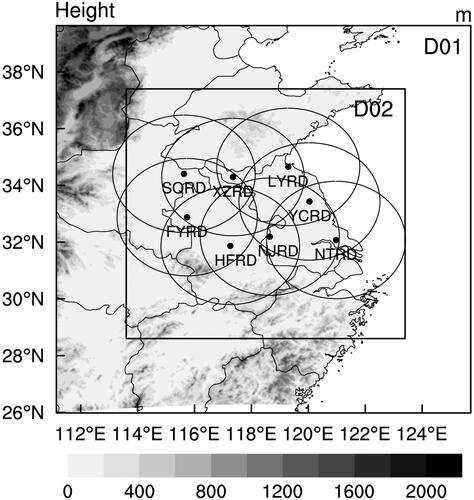
Figure 3. Averaged root mean square innovations (RMSIs) for reflectivity (unit: dBZ) (a), and radial velocity (unit: m s−1) (b) for 3DVar (dashed gray curve), 3DEnVar (solid gray curve) and 4DEnVar (solid black curve) during the assimilation period. The x-axis is time (hour) starting at 0600 UTC 14 June 2009.
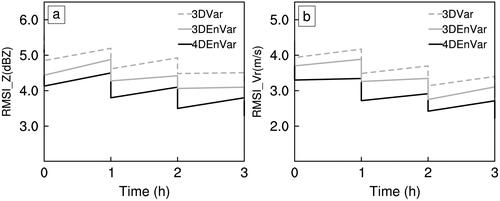
Figure 4. Vertical cross sections of the radar reflectivity (unit: dBZ) (a–d), and relative humidity (unit: %, shaded) and vertical wind (unit: m s−1, vectors) (e–g) along line from 32.4°N, 116.1°E to 33.6°N, 120.9°E from observation (a), 3DVar (b, e), 3DEnVar (c, f), and 4DEnVar (d, g) at the end of the assimilation step. Solid black lines indicate regions of observed reflectivity exceeding 45 dBZ.
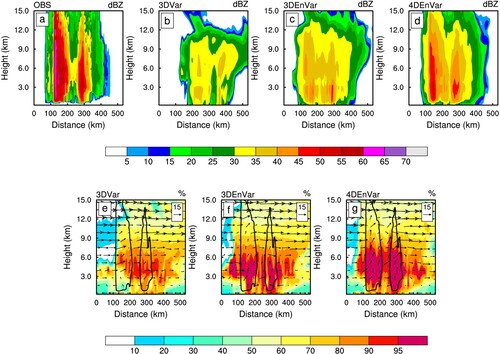
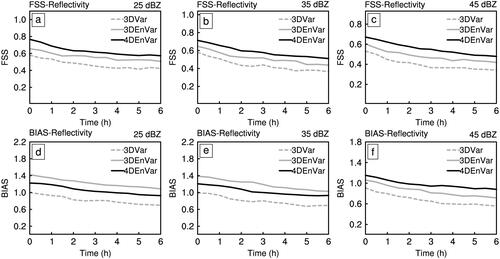
Figure 5. FSS (a–c) and BIAS (d–f) of the 3DVar (dashed gray curve), 3DEnVar (solid gray curve) and 4DEnVar (solid black curve) for reflectivity thresholds of 25, 35 and 45 dBZ. The x-axis is the time starting at 0900 UTC 14 June 2009.
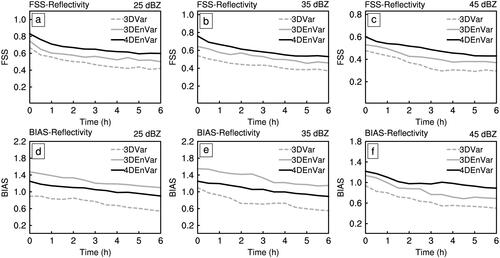
Figure 6. Radar reflectivity (unit: dBZ) from observation (a), 3DVar (b), 3DEnVar (c) and 4DEnVar (d) at 1000 UTC 14 June 2009.
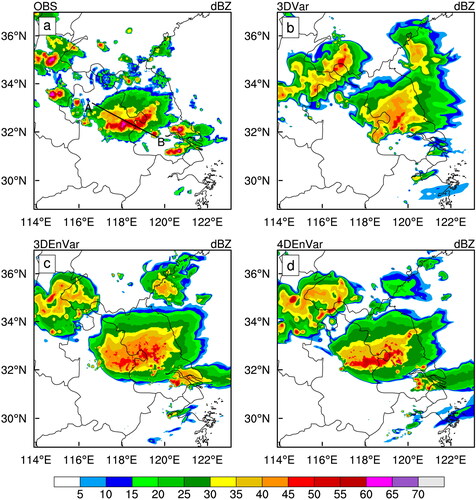
Figure 7. Vertical cross sections of the radar reflectivity (unit: dBZ) along line AB in from observation (a), 3DVar (b), 3DEnVar (c) and 4DEnVar (d) at 1000 UTC 14 June 2009.
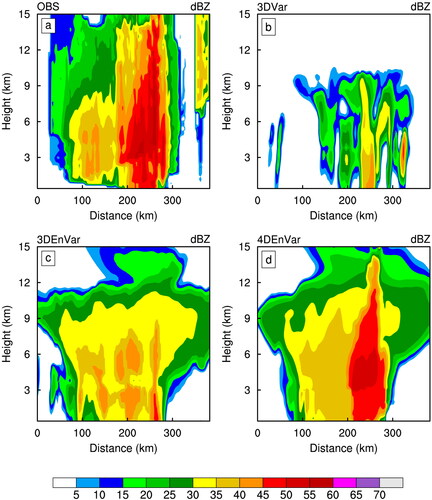
Figure 8. As in but at 1100 UTC 14 June 2009.
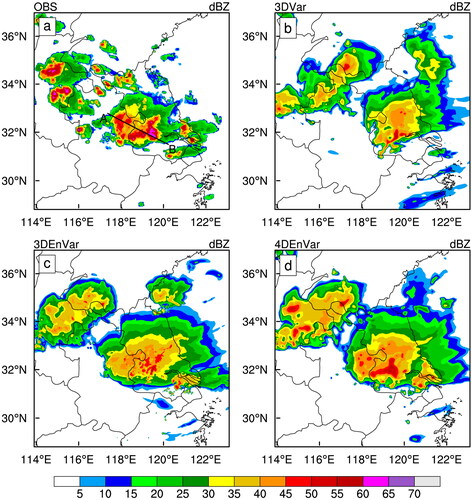
Figure 9. As in but at 1100 UTC 14 June 2009.
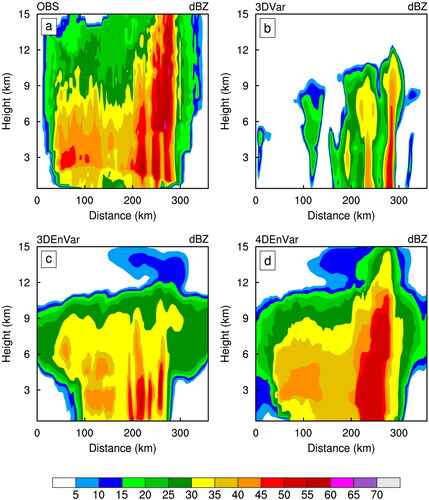
Figure 10. As in but at 1300 UTC 14 June 2009.
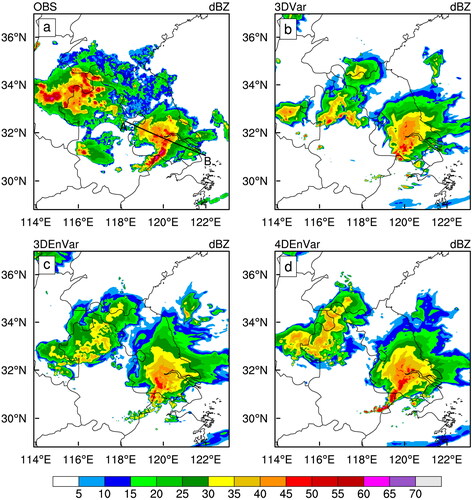
Figure 11. FSSs (a–c) and BIAS (d–f) of the 3DVar (dashed gray curve), 3DEnVar (solid gray curve) and 4DEnVar (solid black curve) for precipitation threshold of 1.0, 2.5 and 5 mm. The x-axis is the time starting at 0900 UTC 14 June 2009.
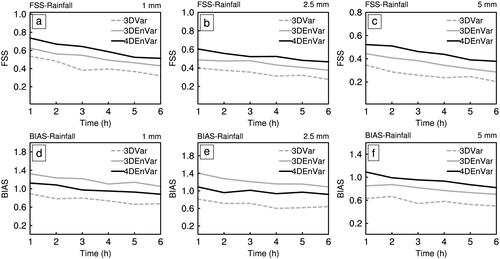
Figure 12. Six-hour accumulated precipitation (unit: mm) from observation (a), 3DVar (b), 3DEnVar (c) and 4DEnVar (d) initial at 0900 UTC 14 June 2009.
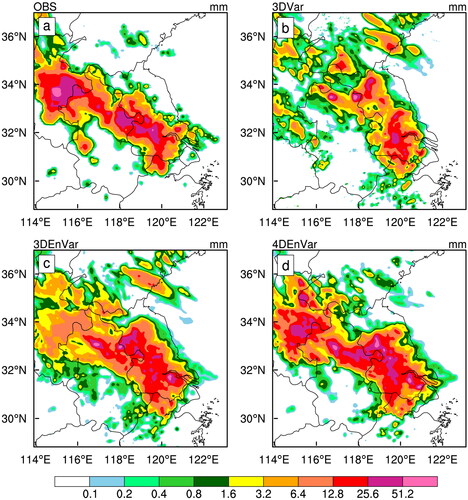
Figure 13. Averaged biases (observation minus forecast) of 3DVar, 3DEnVar and 4DEnVar verified against all the radiosondes in the 3-km domain for the u component (units: m s−1) (a), v component (unit: m s−1) (b), T (units: °C) (c), and Q (units: g kg−1) (d) at 1200 UTC 14 June 2009.
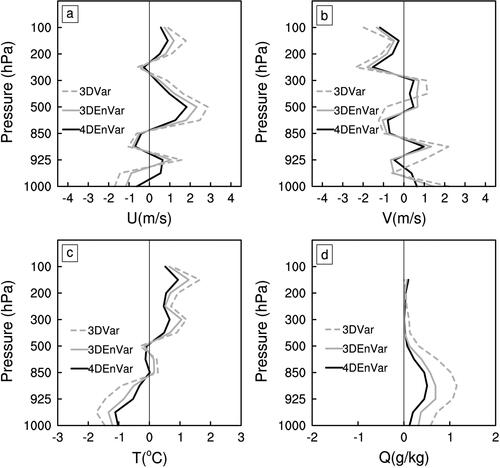
Figure 14. FSS (a–c) and BIAS (d–f) of the 4DEnVar_L20 (dashed gray curve), 4DEnVar_L30 (solid black curve) and 4DEnVar_L40 (solid gray curve) for reflectivity thresholds of 25, 35 and 45 dBZ. The x-axis is the time starting at 0900 UTC 14 June 2009.
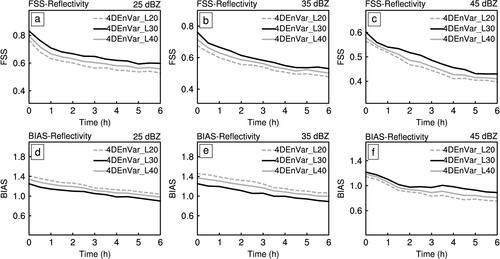
Figure 15. FSS (a–c) and BIAS (d–f) of the 4DEnVar_W25 (dashed gray curve), 4DEnVar_W50 (solid gray curve) and 4DEnVar_W75 (solid black curve) for reflectivity thresholds of 25, 35 and 45 dBZ. The x-axis is the time starting at 0900 UTC 14 June 2009.
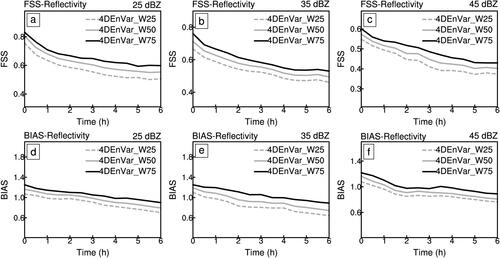
Figure 16. Averaged FSS (a–c) and BIAS (d–f) for two convective cases of 3DVar (dashed gray curve), (c) 3DEnVar (solid gray curve) and (d) 4DEnVar (solid black curve) for reflectivity thresholds of 25, 35 and 45 dBZ. The x-axis is the time starting at 0900 UTC 14 June 2009.