Figures & data
Fig. 1. Definition of South China Sea (SCS) domain (0°-25°N, 110°E-120°E) in this study.
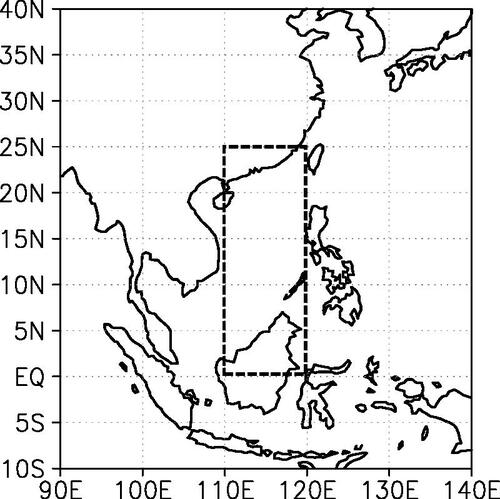
Fig. 2. Time series of South China Sea summer monsoon (SCSSM) index and Niño-3.4 index and their trends for June-September (JJAS). Even though the decreasing trend of the Niño-3.4 index is insignificant, the decreasing trend of the SCSSM index is significant at the 90% confidence level.
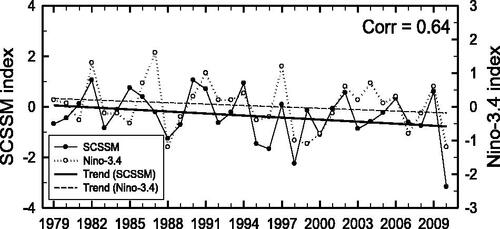
Fig. 3. Differences in (a) OLR, (b) precipitable water, and (c) precipitation between El Niño years and La Niña years.
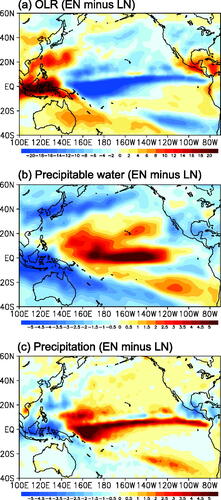
Fig. 4. Same as in , but for (a) 850 hPa stream flows and (b) 200 hPa stream flows. Shaded areas are significant at the 95% confidence level.
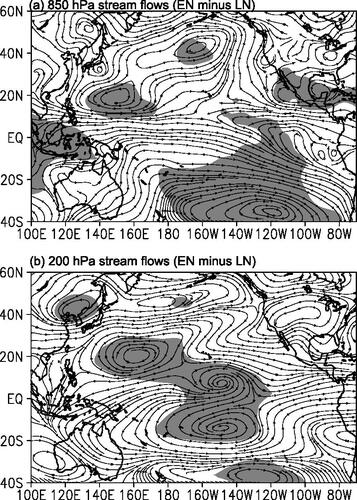
Fig. 5. Composite differences of longitude–pressure cross section of (a) vertical velocity (contours) and zonal circulations (vectors), (b) specific humidity, and (c) air temperature averaged along 0°-20°N between El Niño years and La Niña years for JJAS. The values of vertical velocity are multiplied by −100. Bold arrows and shaded areas are significant at the 90% confidence level. Contour intervals are 0.5−2hPa s−1 for vertical velocity, 0.2 g kg−1 for specific humidity, and 0.3 °C for air temperature, respectively.
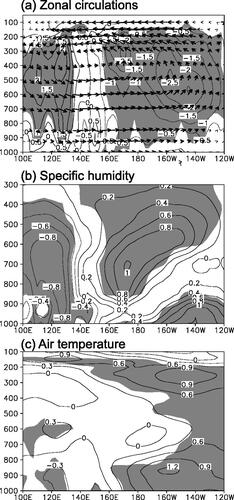
Fig. 6. Same as in , but for sea surface temperature (SST).
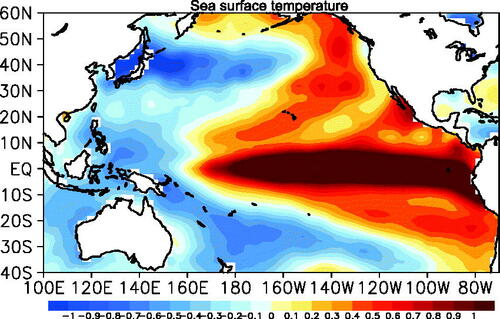
Fig. 7. Time series of SCSSM index and (a) 850 hPa zonal wind and (b) 200 hPa zonal wind averaged for Niño-3.4 region (5°S-5°N, 170°E-120°W). The trends of 850 hPa zonal wind and 200 hPa zonal wind are significant at the 90% and 95% confidence levels, respectively.
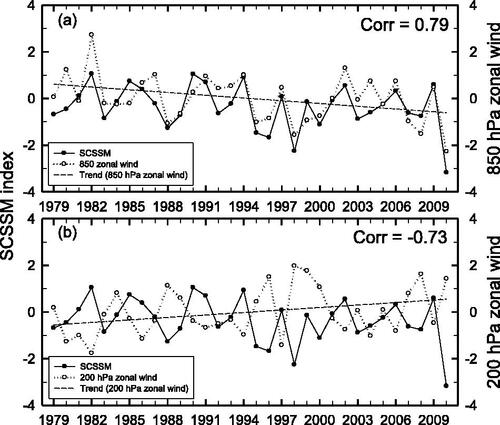
Fig. 8. Differences in the mean TC passage frequencies between El Niño years and La Niña years for JJAS within each 5°×5° latitude-longitude grid box. Small solid rectangles indicate that the differences are significant at the 95% confidence level.
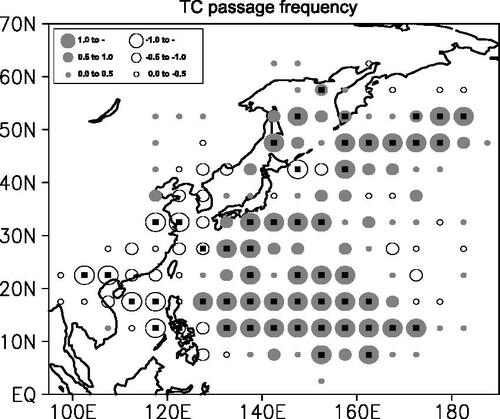
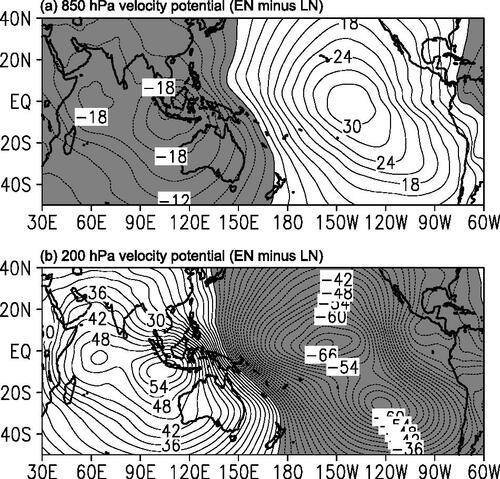
Fig. 9. Same as in , but for (a) 850 hPa velocity potential and (b) 200 hPa velocity potential. Shaded areas denote negative anomalies. Contour interval is 3 m2s−110−6.