
Figures & data
Fig. 1. Annual cycles of the daily integrated SSR for the maximum possible clear-sky solar irradiance (reference value) and the all-sky average irradiance for (a) EUV, (b) TUV, and (c) GS total spectrum from March 2004 to February 2013. The solid and dashed lines show the envelope curves of the data maxima and the curves of the all-sky average values, respectively.
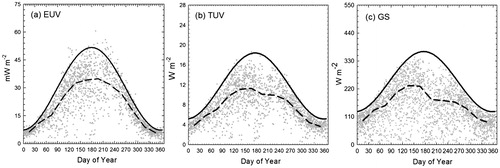
Table 1. Results of the harmonic analysis for the clear-sky model (EquationEquation 3(3)
(3) ).
Table 2. RAFs used in EquationEquation (8)(8a)
(8a) (Kim et al. Citation2014).
Table 3. Annual mean correction ratios of the corrected SSR (EUV, TUV, and GS) to the measured SSR.
Fig. 2. Annual cycles of monthly mean (a) SSI (GS, TUV, and EUV irradiances), number of data to the left vertical axis, and (b) CC, AOD (at 320.1 nm), TCO, and RH, over the period from March 2004 through February 2013.
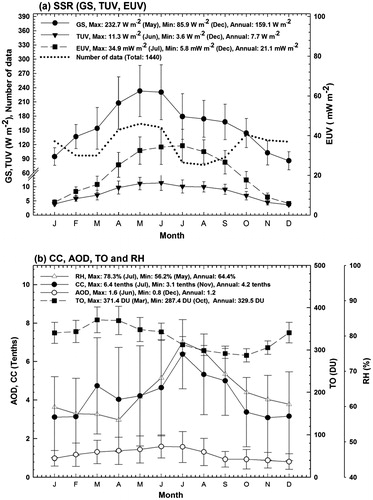
Fig. 3. Annual cycles of (a) total, (b) cloud, (c) aerosol, and (d) ozone transmission in the EUV, TUV, and GS irradiances.
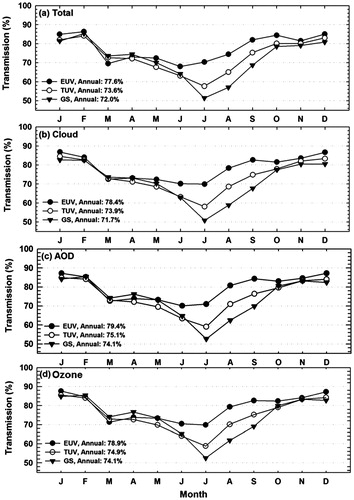
Table 4. EUV, TUV, and GS transmissions (%) grouped by CC amount, AOD, and TCO.
Table 5. Annual averages and seasonal wavelength dependences in total, cloud, aerosol, and ozone transmission (%) increase and decrease with wavelength from EUV through the TUV and GS regions of the solar spectrum.