Figures & data
Fig. 1. Location of Zeppelin station, Ny-Ålesund, Svalbard.
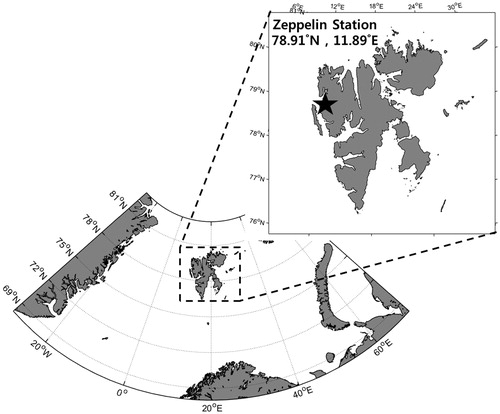
Fig. 2. Monthly median CCN number concentration at various supersaturation (SS) values, April, 2007–March, 2013 (25–75th percentile ranges: Horizontal bars and corresponding values in the boxes represent median concentrations, the box plot of the first and third quartiles, and the bars represent the 10th and 90th percentiles).
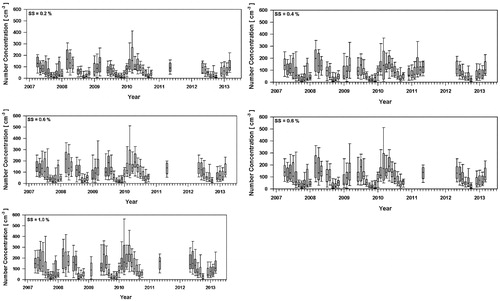
Fig. 3. Box plot of Monthly median CCN number concentration at various supersaturations (SS): April 2007–March 2013.
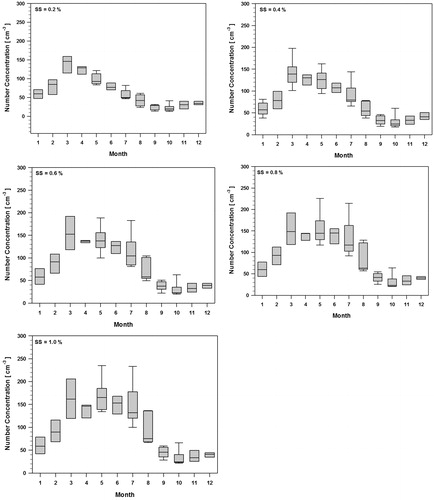
Table 1. Seasonal variation in the parameters for bimodal lognormal aerosol size distribution.
Fig. 4. Monthly variations in aerosol median size distribution.
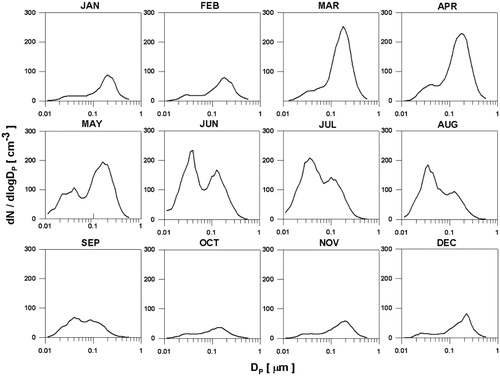
Fig. 5. Monthly ratios of the CCN to the CN >10nm (particle concentration larger than 10nm in diameter) at various SS.
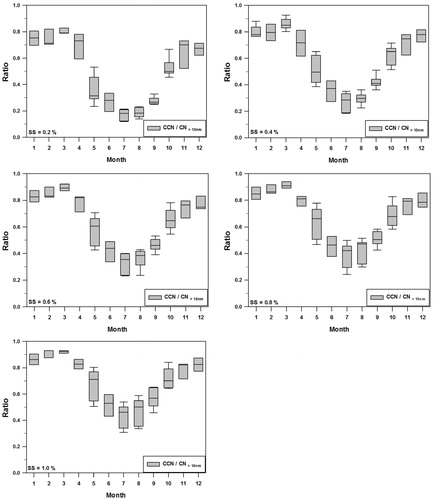
Fig. 6. Activation ratios of the CCN to CN >10nm (particle concentration larger than 10nm in diameter) as a function of SS.
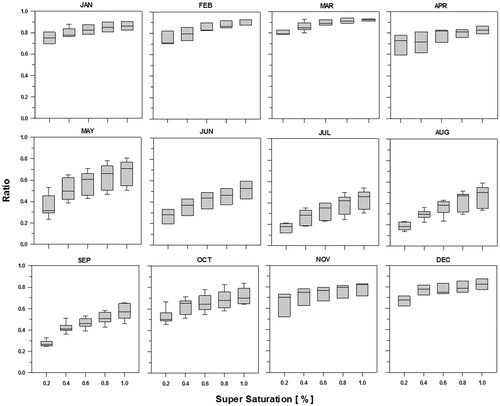
Figure 7. Box plot of daily median CCN concentration for each supersaturation (SS) values. Medians of the total numbers of CCN for each SS scan.
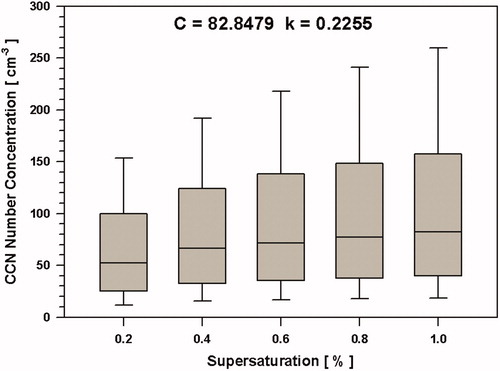
Fig. 8. Monthly variations of CCN spectra parameters (C and k) during the sampling periods.
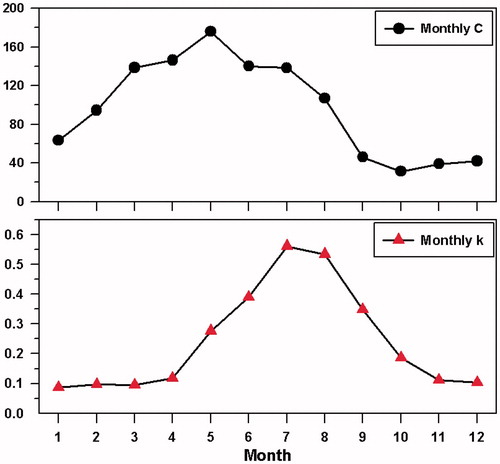
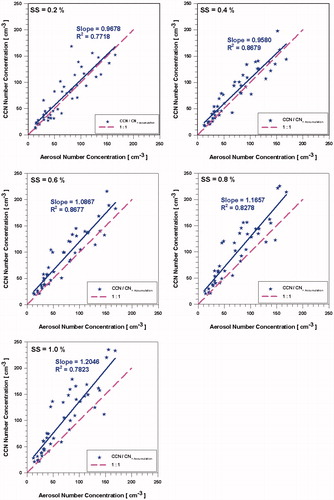
Fig. 9. Comparison of the CCN concentration versus aerosol number concentrations of accumulation mode.