Figures & data
Fig. 1. Temporal variations in PM2.5 mass concentration, surface radiation, and surface and vertical distributions of meteorological factors from 25 December 2017 to 1 January 2018 (a) PM2.5 mass concentration (gray or colored line: Beijing; light gray line: Baoding; gray dot: Shijiazhuang); (b) winds (vectors) and wind velocity (shadings; units: m/s); (c) temperature (shadings; units:°C); (d) RH (shadings; units: %); (e) direct (of the vertical surface to the direction of solar radiation) radiant exposure and global radiant exposure; (f, g, h, i) surface wind distribution in Beijing (the shading represents topography). (Green boxes or lines: the transport stage; blue boxes: relative strong southerly winds; red boxes or lines: the cumulative stage; white or gray boxes: the meteorological characteristics of the cumulative stage).
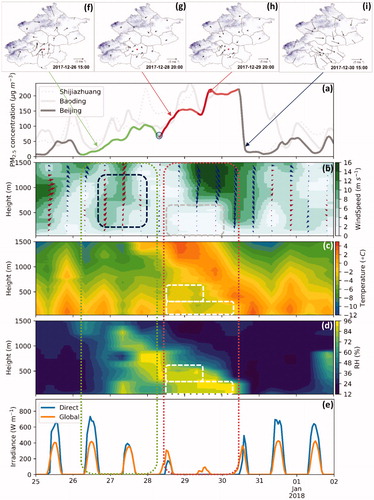
Table 1. Characteristics of HPEs with the CS in winter (Jan., Feb, and Dec) from 2013 to 2017.
Fig. 2. Mean profiles of temperature before the CS, during the earlier period in the CS, and during the later period in the CS respectively in all the 30 CSs.
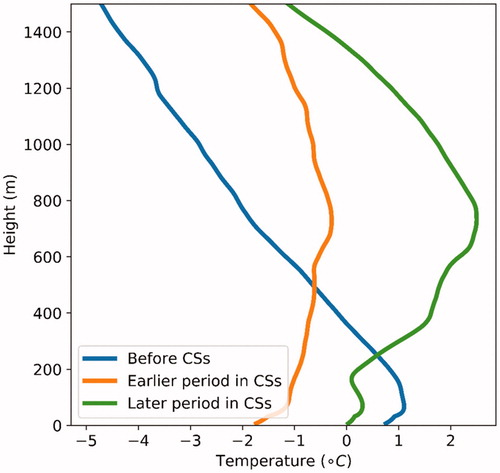
Fig. 3. Threshold values for PM2.5 explosive growth in all 30 CSs.
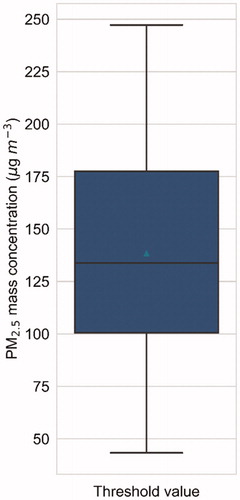
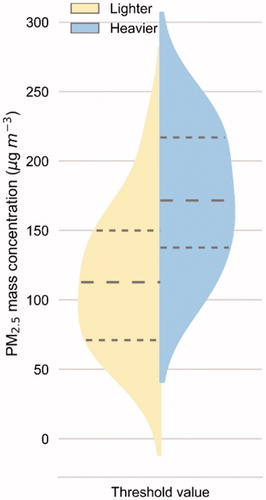
Fig. 4. Threshold values for PM2.5 explosive growth during the CSs in lighter HPEs (left) and heavier HPEs (right) respectively.