
Figures & data
Table 1. List of observations over Finland and surrounding regions.
Table 2. List of inversion setups.
Fig. 1. Statistics (bias, correlation and root mean squared error (RMSE)) of posterior atmospheric CH4 compared with assimilated observations from sites in Finland and surrounding regions. Negative bias shows model underestimation. The statistics were calculated from 2010–2014 observations, except for KJN, where 2013–2014 data were used. The statistics for Puijo (PUI) and Kumpula (KMP) for J2 were plotted separately, as those were not assimilated in J2, and the statistics are calculated from posterior estimates and all prepossessed daily observations.
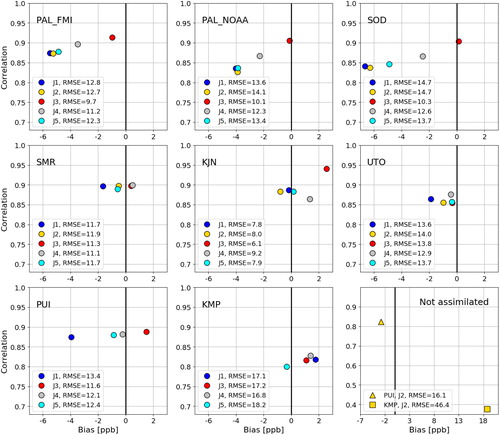
Fig. 2. Observed and simulated atmospheric CH4 at sites in Finland and surrounding regions for 2012, except for Kjølnes which shows data from 2014. For continuous observations, the daily averaged values are shown. For complete time series for all inversions, see Supplementary Material.
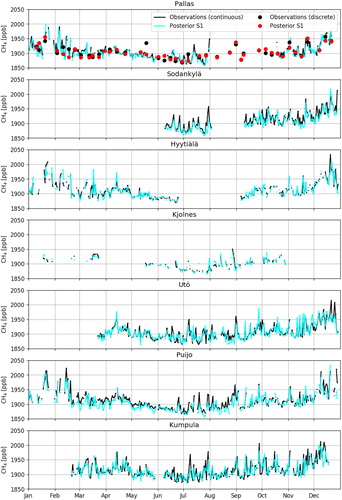
Fig. 3. [Top and middle] Monthly prior and posterior anthropogenic and biospheric emission estimates for Finland. The shaded areas show uncertainty ranges of the prior (grey) and the J1 posterior (blue). [Bottom] Number of Fennoscandian stations assimilated in J1 and J5. Note the number in J2 was same as in J1.
![Fig. 3. [Top and middle] Monthly prior and posterior anthropogenic and biospheric emission estimates for Finland. The shaded areas show uncertainty ranges of the prior (grey) and the J1 posterior (blue). [Bottom] Number of Fennoscandian stations assimilated in J1 and J5. Note the number in J2 was same as in J1.](/cms/asset/84bc9cb8-899b-40d8-b3d9-c2def5a2300b/zelb_a_1565030_f0003_c.jpg)
Fig. 4. Measured CH4 fluxes at Lompolojänkkä and Siikaneva, and estimated regional monthly mean biospheric CH4 fluxes around the sites.
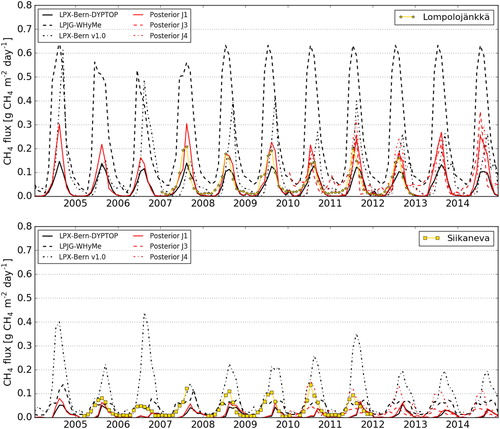
Fig. 5. Mean annual emission estimates for 2010–2014 [10–8 mol m−2 s−1], their uncertainty reduction (), and locations of observations in Fennoscandia. The triangles show sites with continuous observations and the star shows the site with both continuous and discrete observations. For other inversions, see Supplementary Material.
![Fig. 5. Mean annual emission estimates for 2010–2014 [10–8 mol m−2 s−1], their uncertainty reduction (1−σposterior2/σprior2), and locations of observations in Fennoscandia. The triangles show sites with continuous observations and the star shows the site with both continuous and discrete observations. For other inversions, see Supplementary Material.](/cms/asset/890f5279-84b3-4799-abfb-a1ec3c31c17c/zelb_a_1565030_f0005_c.jpg)
Table 3. Average annual CH4 emission estimates between 2010 and 2014 in Finland [Tg CH4 yr−1].