Figures & data
Table 1. List of monthly integrated and event based precipitation samples and their isotope values from two stations in the Western Pamir Mountains.
Fig. 1. Map of Global Network of Isotopes in Precipitation (GNIP) stations (larger symbols) and additional data (smaller symbols) used for calculation of regional deuterium excess averages. Grey stars show sampling sites of this study in the Western Pamir Mountains.
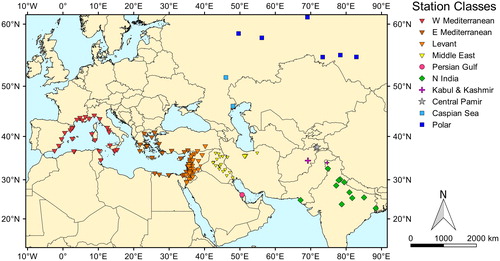
Fig. 2. Map of air mass trajectories leading up to rain events in the Western Pamir Mountains. Different classes of moisture origin are color-coded. Small insert displays long distance trajectories. For a detailed description of trajectory classification see text.
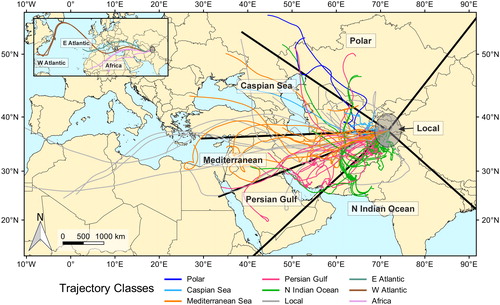
Fig. 3. Dual isotope plot of δ2H against δ18O (VSMOW) for monthly integrated isotope samples of the Western Pamir Mountains. Grey dotted line is the Global Meteoric Water Line (GMWL, see EquationEq. 1(1)
(1) ). Black solid line is the Local Meteoric Water Line (LMWL) as calculated from the samples.
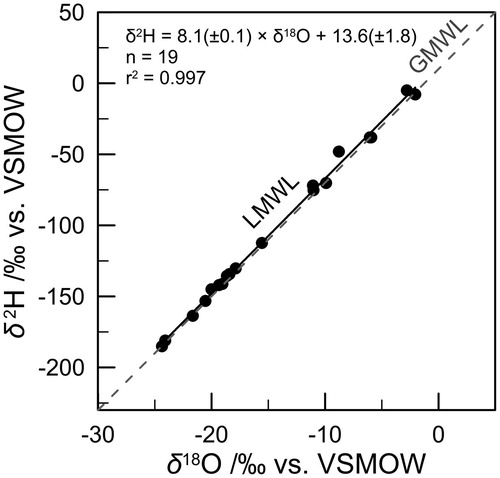
Fig. 4. Monthly deuterium excess (d) values for regional classes, corresponding to stations in . Plots are arranged in their respective geographic setting. Solid lines are precipitation amount weighted d-averages (EquationEq. 5(5)
(5) ), dashed lines are non-weighted arithmetic means (EquationEq. 4
(4)
(4) ). The dotted line in the “Kabul and Kashmir” subplot is the non-weighted arithmetic mean of the Kashmir valley after Jeelani et al. (Citation2017). Sample size is shown in lower left corner of each subplot.
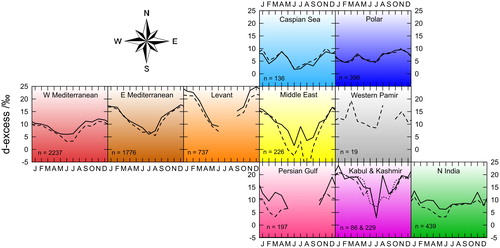
Fig. 5. Statistics of air mass trajectories. (a) Number of trajectories per month that had the majority of their moisture uptake in the area of a certain class. (b) Monthly percentage of the total amount of specific humidity that arrived at the measurement site via the calculated trajectories.
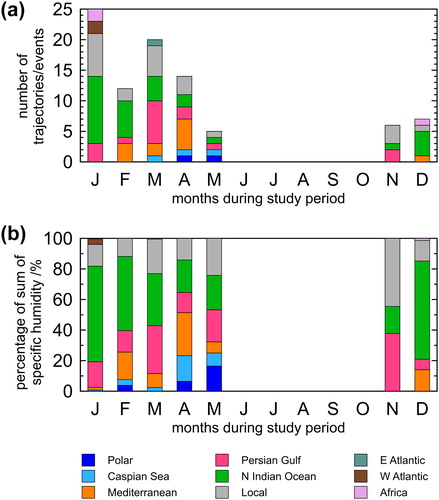
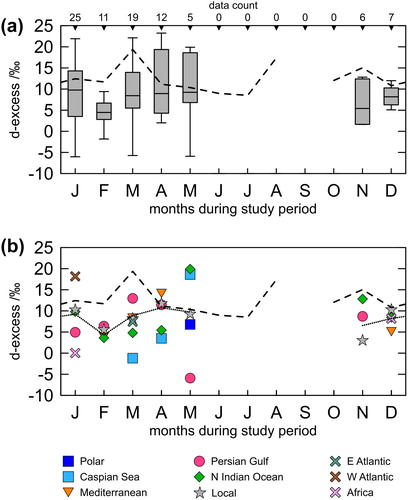
Fig. 6. Deuterium excess of rain events at the termination of air mass trajectories. (a) Boxplot of all event samples (whiskers end at last values inside 1.5 IQR), including sample size for each box at the top axis. (b) Monthly averages for event samples of every class. For number of trajectories per plot symbol refer to . Dashed line represents monthly d values of the Western Pamir class of monthly-integrated samples (see grey plot of ), dotted line represents monthly average of all event values.