Figures & data
Fig. 1. Input data for MACv2. Shown are the multi-annual averages of aerosol optical properties at 550 nm based on local sun-photometer measurements by AERONET and MAN (left block, local data are enlarged for better viewing) and by the AeroCom ‘bottom-up’ modelling ensemble (right block). The four sub-panels in each block display the aerosol optical depth AOD (upper left), the absorption aerosol optical depth AAOD (lower left, multiplied by a factor 10), the fine-model aerosol optical depth AODf (upper right) and the fine-mode effective radius REf (lower right). As sun-photometers over oceans (of MAN) can only address AOD and AODf properties, data coverage over oceans for AAOD and REf is poor.
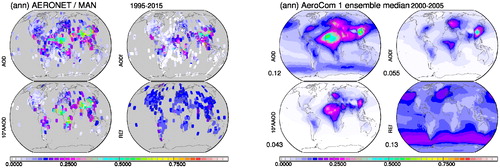
Fig. 2. AERONET/MAN observation suggested (factor-1) changes to background data from modelling for the four properties of – by region. Red colours indicate the need to increase model properties (with 1 referring to a doubling), blue colours require a reduction (with –1 referring to half the value) and grey colours indicate no changes due to a lack in reference data. Presented are for the four properties of (of AOD, 10*AAOD, AODf and REf) annual average adjustments for the selected 21 regions before (left block) and after after (+/– 6 deg lon, +/–3 deg lat) smoothing (right block). Smoothed changes are applied to create MCv2 maps. Values below the labels are adjustment averages.
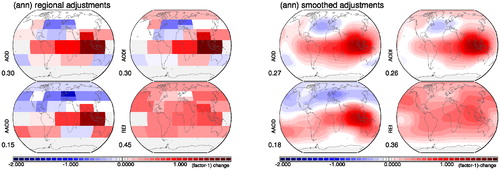
Fig. 3. Annual average maps of the MACv2 aerosol climatology. Global distributions (as result of the data-merging) are presented (left block) for the mid-visible AOD (column amount), for the mid-visible AAOD (column absorption – here multiplied by 10 to fit the common scale) and for the fine-mode properties for the mid-visible AOD (AODf) and effective radius (REf). Also presented are by size-mode annual maps for AOD and 10*AAOD maps for the fine-mode (right block, left column) and coarse-mode (right block, right column). Values below labels present global averages.
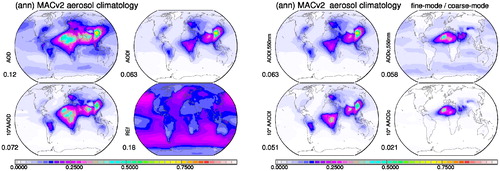
Fig. 4. Size-distributions of standard aerosol components (left block, with those for a water and ice cloud as reference) and for different sizes of sulfate and dust (right block, with effective radius values).
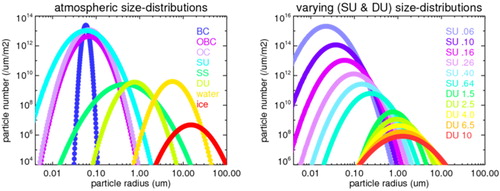
Fig. 5. Assumed real (left block) and imaginary part (right block) parts of the refractive indices for the different aerosol components (and for water and ice) of for central wavelengths representing the 30 spectral bands of the RRTM radiative transfer model. References are Hale and Query (Citation1973) for water, Warren (Citation1984) for ice, Palmer and Williams (Citation1975) for sulfate solutions, Nakayama et al. (Citation2010) for organic aerosol, Bond (private communication) for BC, Nilsson (Citation1979) for seasalt and Sokolik (private communication) for dust in the infrared and Wiedensohler (private communication) for dust in the solar region. Note, that the imaginary part of (only) 0.001 for dust was derived from by the mid-visible coarse-mode size and absorption of MACv2.
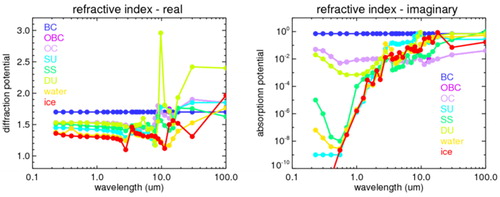
Table 1. Pre-defined aerosol types with assumed effective radii (RE), the associated log-normal size-distribution parameters (in bold) of mode radius (RM) and standard deviation (sd).
Fig. 6. Annual average AOD maps for today’s tropospheric aerosol for total (top left) and contributions by fine-mode aerosol sizes (top centre) and coarse-mode aerosol sizes (top right). In addition, consistent with mid-visible absorption data, component AOD values were assigned. The fine-mode AOD (‘aDU’ based on an anthropogenic dust fraction by P.Ginoux when applied to the MACv2 dust AOD, here multiplied by 10) is divided into contributions by BC (soot, here multiplied by 10), organic matter (OC) and sulfate (SU. where SU represents the non-absorbing fine-mode including nitrate and fine-mode sea-salt). The coarse mode AOD is split into contributions by seasalt and dust. In addition, annual AOD maps are presented for total carbon (OC + BC), for today’s anthropogenic dust (‘aDU’, here multiplied by 10, based on fractions provided by P. Ginoux) and two different estimates of today’s anthropogenic fine-mode AOD: ‘ant AC1’ is based on a fine-mode AOD fraction of AeroCom1 simulation and used in the MACv1, ‘ant AC2’ is based on a fine-mode AOD fraction of AeroCom2 and used in the MACv2. Values below the labels indicate global averages.
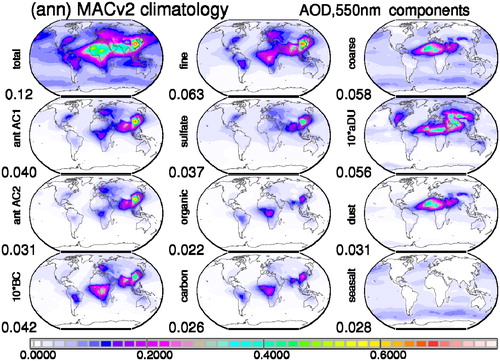
Fig. 7. Monthly effective radii (in μm) for dust (left block) based on MACv2 AAODc data and effective radii (in μm) for the non-absorbing fine-mode type (right block, SU), based on MACv2 REf data.
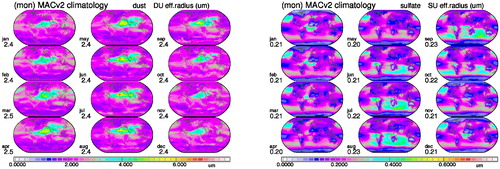
Fig. 8. Annual AOD (at 550 nm) maps in 20 steps from 1865 to 2085 for anthropogenic (left block) and total aerosol (right block) in the troposphere. Values below the label indicate global averages.
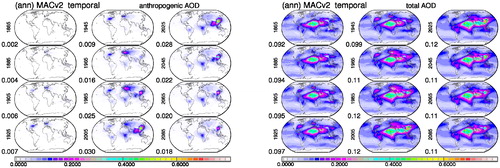
Table 2. Global annual average aerosol radiative properties of today’s (tropospheric) aerosol.
Table 3. Annual averages of vertical distributions for the mid-visible AOD for four altitude (above sea-level) atmospheric layers (associated global maps are presented in Appendix B).
Fig. 9. Annual averages for critical radii (left block) at four different supersaturations: 0.05% (upper left), 0.07% (lower left), 0.1% (upper right) and 0.2% (lower right). Corresponding CCN concentrations at lower cloud base (at 1 km above the ground) at these supersaturations presented as well (right block). Hereby natural (left column), anthropogenic (mid column) and total contributions (right column) are compared.
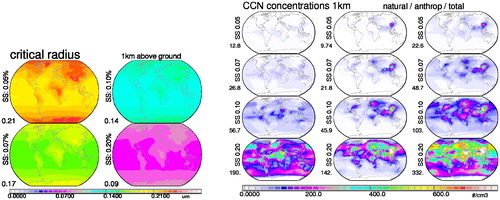
Fig. 10. Annual average estimates for IN (dust) concentrations at 7 km (left), at 9 km (centre) and at 12 km (right). Note the log10 axis, so that 2 refers to 100 (/m3) and 6 to 1,000,000 (/m–3).
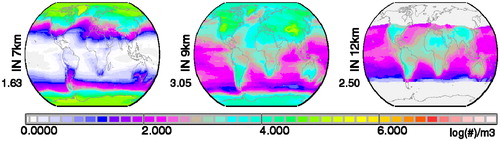
Fig. 11. Frequency of coarse-mode effective radius (x-axis) and fine-mode effective radius (y-axis) based on size-distribution detail of AERONET at all available sites (11,245 monthly averages in total).
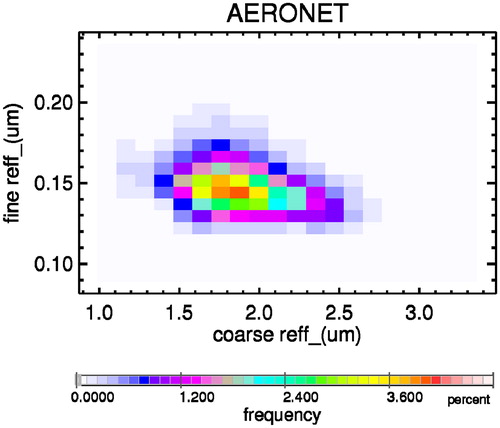
Fig. 12. MACv2 associated mid-visible global maps for assistance in aerosol model choices in satellite retrievals. Annual averages (left block, left column) and seasonal averages (right block) are presented for total AOD at 550 nm and absorption type fractions for fine-mode AOD and coarse mode AOD. The AOD split is assigned by the fine mode fraction whose annual averages (left block, right column) are presented for twice the MACv2 AOD, for the standard MACv2 AOD and half the MACv2 AOD. In the context of the absorption fraction, absorption types have a single scattering albedo of .7693 (SSAf) and .7457 (SSAc) for fine-mode and coarse-mode, respectively, while the alternate scattering types have a single scattering albedo of 1.0. Note, the coarse mode absorption includes enhanced absorption by larger mineral dust sizes. Also shown in the left block are annual averages for (today’s) anthropogenic AOD and the complementary scattering fractions.
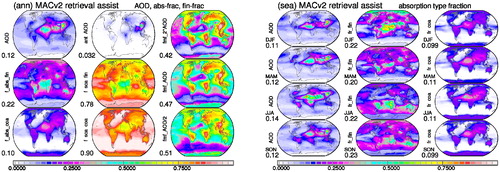
Table 4. MACv2 properties in comparison to those of MACv1 (Kinne et al., Citation2013), of the AeroCom phase 1 median (Kinne et al., Citation2006) and of the ICAP ensemble modelling (Peng et al., Citation2019).
Fig. A1. MACv2 (2005) fine-mode radiative properties of AOD, SSA and ASY (at 0.45, 0.55, 1.0, 1.6 μm).
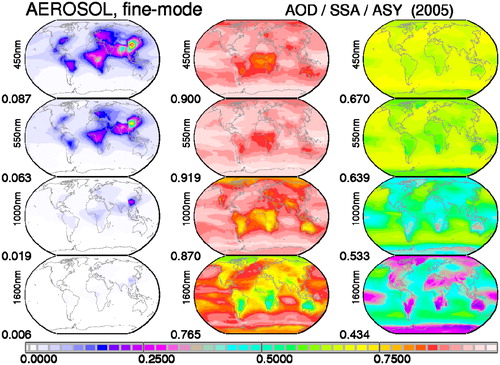
Fig. A2. MACv2 coarse-mode radiative properties of AOD, SSA and ASY (at 0.45, 0.55, 1.0, 10 μm).
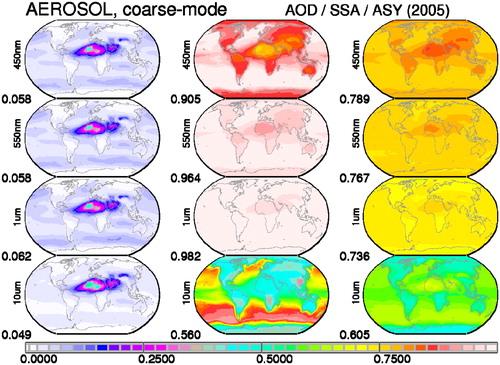
Fig. A3. MACv2 (2005) total aerosol properties of AOD, SSA and ASY (at 0.45, 0.55, 1.0, 10 μm).
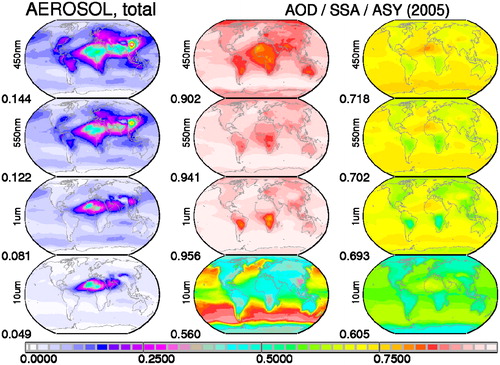
Fig. A4. MACv2 (2005) anthropogenic aerosol radiative properties of AOD, SSA and ASY (at .45, .55, 1.0, 1.6 μm) for today’s conditions. In MACv2 anthropogenic AOD is a fraction of the fine-mode AOD. Thus, anthropogenic SSA (composition) and ASY (size) properties are that of fine-mode aerosol. Local monthly anthropogenic SSA and ASY in MACv2 do not change for different years.
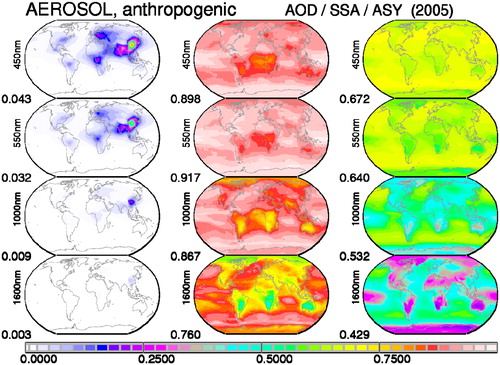
Fig. B1. ECHAM-HAM based multi-annual relative altitude distribution fractions (sum over all layer is 1) for total aerosol (left column), for the fine-mode (centre column) and for the coarse mode (right column).
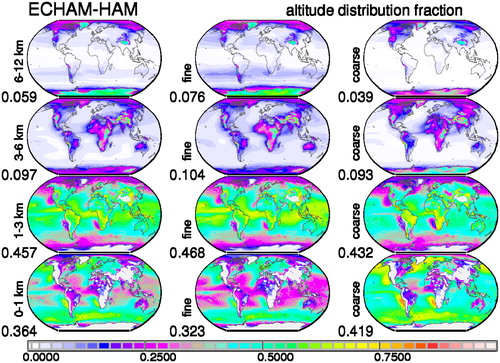
Fig. B2. MACv2 AOD vertical distribution with the ECHAM-HAM vertical scaling for total aerosol (left column), for fine-mode aerosol (centre column) and the coarse mode aerosol (right column).
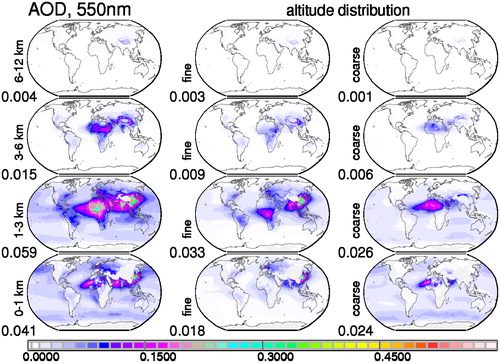
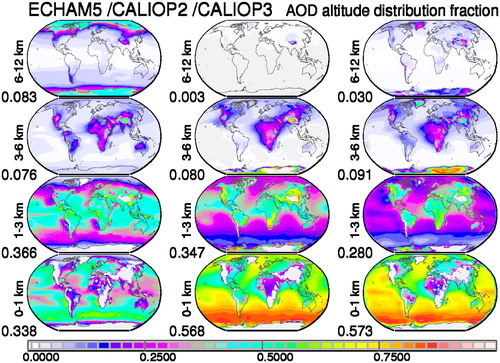
Fig. B3. Multi-annual relative altitude distribution fractions (sum over all layer is 1) for total aerosol between ECHAM_HAM (left column) and CALIPSO version 2 (centre column) and version 3 (right column).