
Figures & data
Fig. 1. Concentrations of water-soluble ions in SPM sampled at Akita Prefectural University during spring (March–May), summer (June–August), autumn (September–November), and winter (December–February) between April 2008 and December 2010.
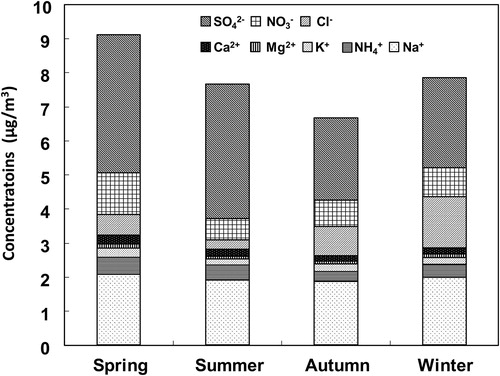
Fig. 2. Variations of (a) δ15N-NH4+ values and NH4+ concentrations, and (b) δ15N-NO3– values and NO3– concentrations in samples collected at Akita Prefectural University from April 2008 to December 2010.
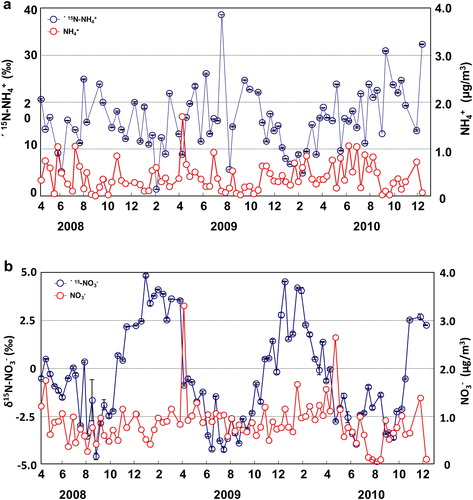
Table 1. Seasonal concentration (± S.D.) data for NH3 and NH4+, the NH3/NH4+ ratio, δ15N-NH3, and δ15N-NH4+, and the NH3–NH4+ fractionation factor (εNH3–NH4+) for samples collected at Akita Prefectural University from December 2009 to December 2010.
Fig. 3. Variations from December 2009 to December 2010 of (a) δ15N-NH4and δ15N-NH3 in ambient air and at the cow barn site; (b) δ15N-NO3–, δ15N-NOx, and δ15N-HNO3 (including HONO) in ambient air and δ15N-NOx and δ15N-HNO3 (including HONO) at the cow barn and roadside sites.
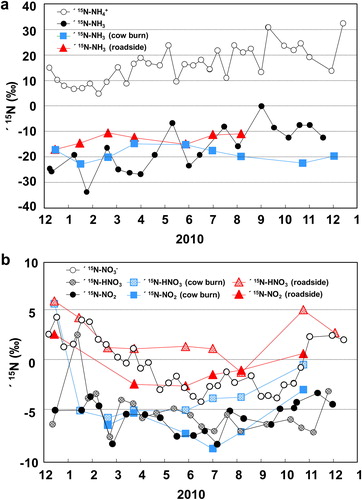
Fig. 4. Scatter plots between (a) δ15N-NH4+ and air temperature, and (b) δ15N-NO3–and air temperature at Akita Prefectural University based on data from December 2009 to December 2010.
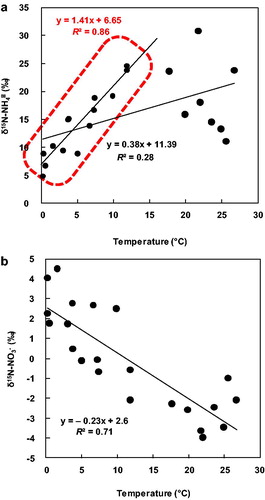
Table 2. Seasonal concentration (±S.D.) data for NO2, HNO3 and NO3–, the NO2/HNO3 and HNO3/NO3– ratios, δ15N-NO2, δ15N-NO3, δ15N-NO3–, and the fractionations factors (ε) for NO2 to HNO3, HNO3 to NO3–, and NO2 to NO3– for samples collected at Akita Prefectural University from December 2009 to December 2010. HNO3 is including HONO.