Figures & data
Fig. 1. (a) The composite response of δ18O of GNIP according to the 20CR V2 500 mb gph clustering indices. Colour bar represents normalized (z-scored) values. (b) The North Atlantic weather regimes according to 20CR V2 500 mb gph for the period of 1871–2012. The average z-score values for 11 central European stations (excluding Reykjavik, Svalbard and Ankara) show δ18O enrichment for NAO+ (1.25‰) and δ18O depletion for NAO− (−0.51 ‰), indicating a clear δ18O response associated with the different phases of NAO. For the Atlantic Ridge, negative anomalies are present over central Europe although the average anomaly is weak (0.05 ‰) while East N-America shows tendencies towards positive anomalies (two positive stations out of three). The Scandinavian Blocking shows the opposite, where anomalies over central Europe show positive anomalies with an average value of 0.40 ‰ while on the other side of the North Atlantic two out of three stations show negative anomalies.
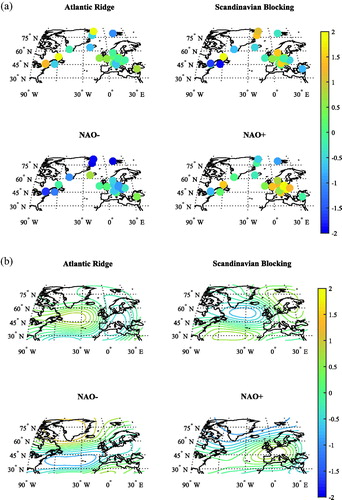
Fig. 2. The δ18O pattern associated with the 500 mb gph weather regimes of ECHAM5-wiso retrieved by using clustering indices from the 500 mb gph for the period of AD 800–2000. (a) is the study area, the North Atlantic, superimposed with GNIP δ18O of for reference and (b) is the same but zooms in on Greenland. Colour bar represents normalized (z-scored) δ18O values.
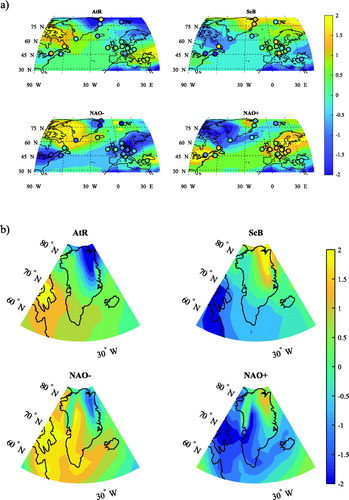
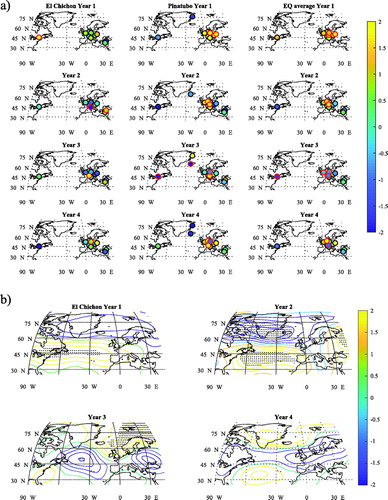
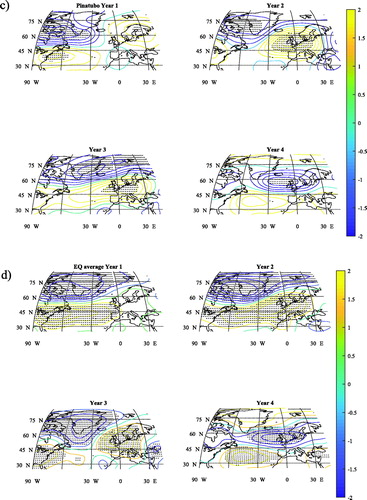
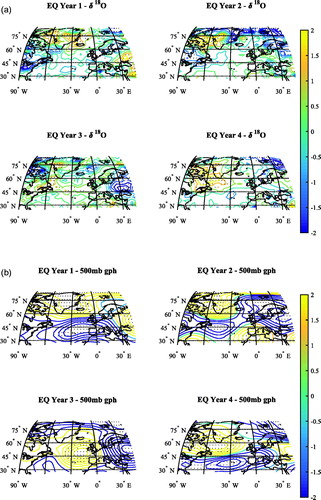
Fig. 5. The atmospheric circulation responses as detected in (a) the δ18O of GNIP in the North Atlantic (coloured circles) and (b) The 20CR 500 mb gph after Hekla and Sarychev Peak along with the average NH response. Shaded areas are significant at the 95% confidence level. Colour bar represents normalized (z-scored) values.
Fig. 6. The North Atlantic meridional T2m (K) anomaly for each EQ (left) and NH (right) post-volcanic year analyzed where anomalies are calculated with respect to 15 years prior to each event. Black circles are significant at the 95% confidence level.
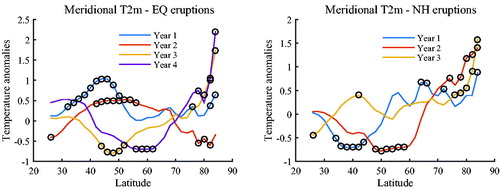
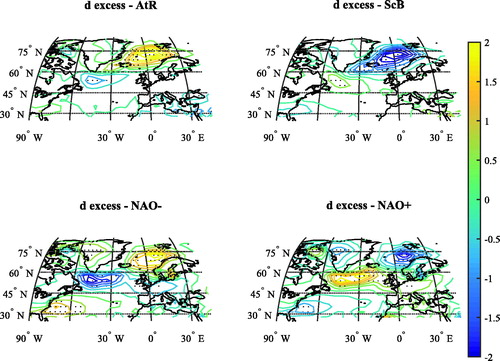
Fig. 7. ECHAM5-wiso deuterium excess anomaly pattern associated with each 500 mb gph weather regime. Dotted area is significant at the 95% confidence level.