
Figures & data
Fig. 1. Installation of Arago actinometer from Marie-Davy (1875).
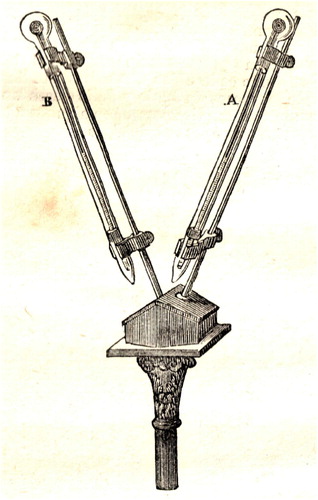
Fig. 2. Old map of the city of Cáceres (Spain) showing the position of the meteorological station located at the terrace of the High School.
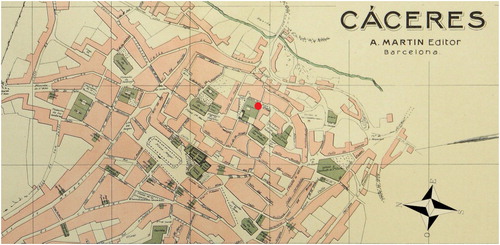
Fig. 3. Evolution of the deseasonalised daily time series for actinometric data from January 1913 to December 1920 in Cáceres (Spain).
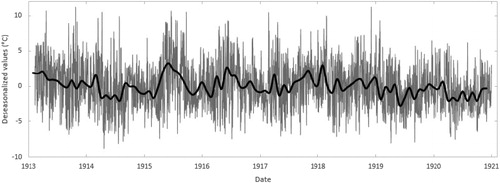
Table 1. Deseasonalised daily values linear trends for each season in °C/year (±standard error) at Cáceres for the whole period 1913–1920.