
Figures & data
Fig. 1. The main air masses influencing Iran and Iraq and their directions (a) and the precipitation sampling points in the study region (b).
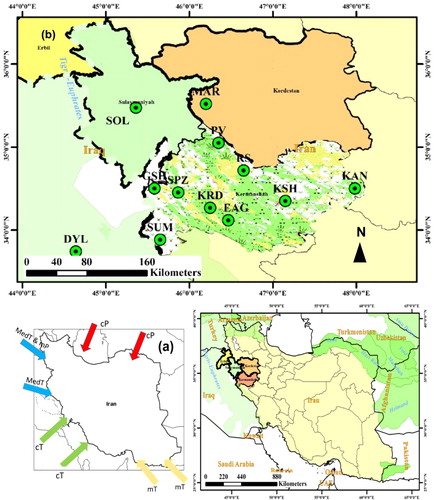
Fig. 2. The land use map of the study region.
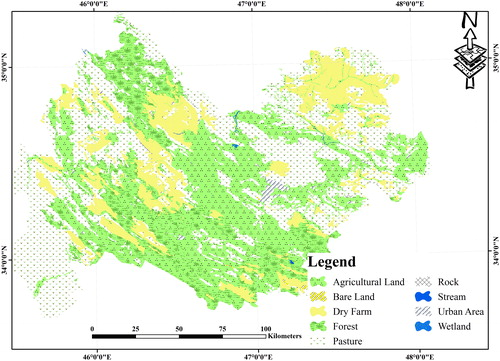
Table 1. The meteorological characteristics of the west of Iran (based on the data of the meteorological stations in Sanadaj, Kermanshah, Ilam, Marivan, Paveh, Ghasreh Shirin, and Dareh Shahr).
Fig. 3. The schematic picture of a rainwater collector and the procedure for sampling the stable isotopes.
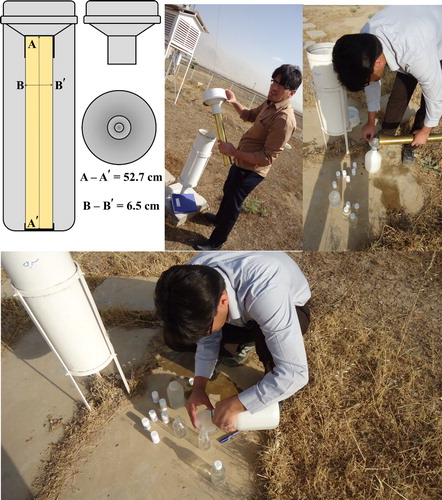
Table 2. The variations of precipitation, temperature, δ18O, δ2H, and d-excess in the studied stations in Iran and Iraq.
Fig. 4. The moisture sources of precipitation from December 2011 to March 2012 and from March 2015 to December 2015 in the study region detected using the backward trajectories of the HYSPLIT model (% demonstrates the frequency of the trajectories).
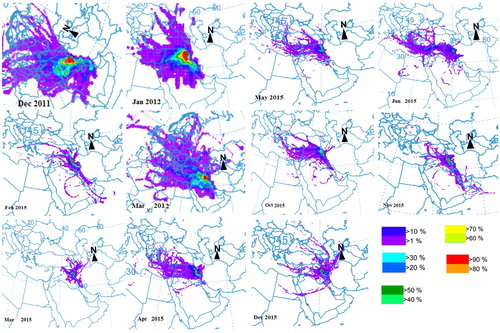
Fig. 5. The spatial distribution of the vertically integrated moisture flux over the water bodies which provide moisture for precipitation in Iran and Iraq (from 1981 to 2015).
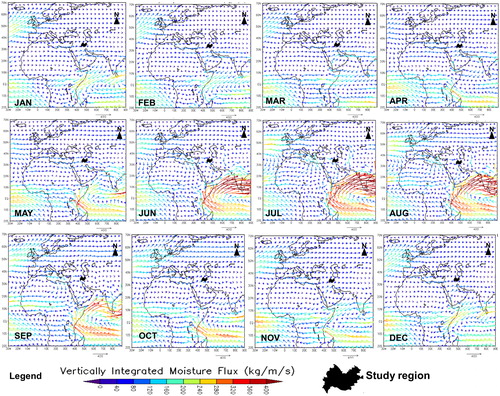
Fig. 6. The seasonal and total developed MWLs for the study region and comparing them with GMWL and EMMWL.
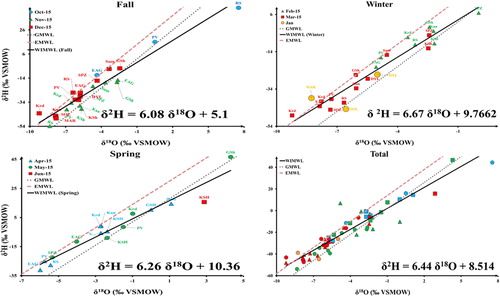
Fig. 7. The correlation of the content of δ18O in precipitation with the variations of the precipitation amount (a) and temperature (b) in the study region.
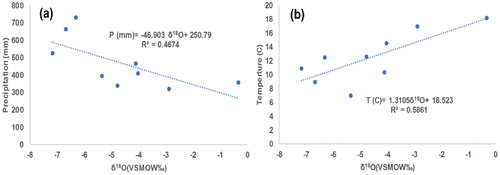
Fig. 8. The predicted values of δ2H and δ18O (A and C) and their corresponding error values (B and D) for the study region.
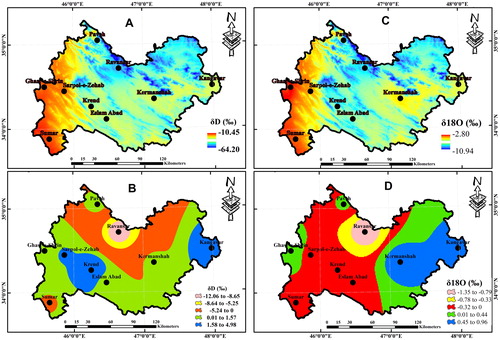
Table 3. δ18O and δ2H of precipitation in the study region based on the outputs of the predictive model.
Fig. 9. The correlation between the δ18O content in precipitation and the elevation variations of the sampling stations in the study region.
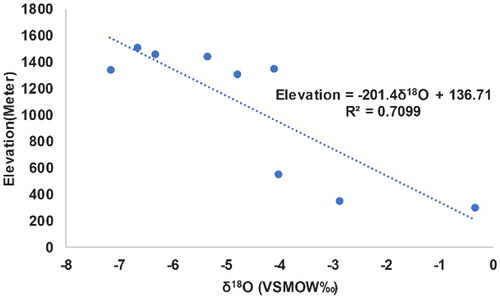
Fig. 10. Plotting the surface water resources in the study region on the developed seasonal and total MWLs.
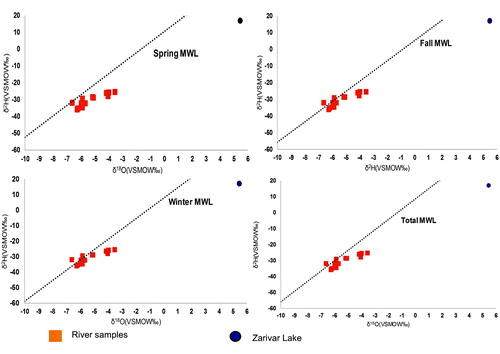
Table 4. The δ18O and δ2H contents of surface water resources in the study region.