Figures & data
Fig. 1. Map showing the location of Kathmandu sampling site (yellow dot) on the south of Himalayas.
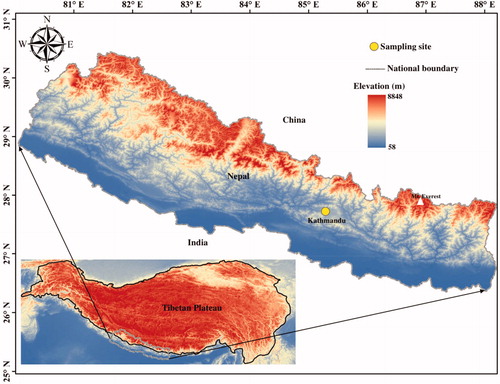
Fig. 2. Variation of monthly mean temperature (T), monthly sum of precipitation (P) and monthly average relative humidity (RH) at Kathmandu station from 2001 to 2018. Green line, blue line and grey bar represent relative humidity, temperature and precipitation, respectively.
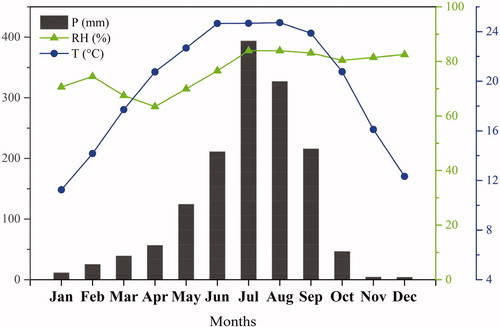
Fig. 3. Relationship between δ18O and δD values of (a) overall precipitation and (b) monsoon and non-monsoon precipitation at Kathmandu.
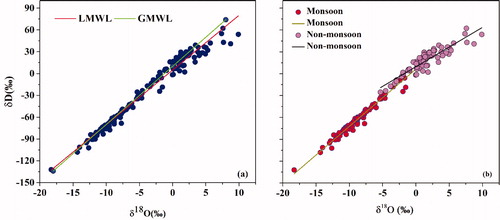
Fig. 4. (a) Temporal variations in precipitation amount, temperature, relative humidity, d-excess, δD, and δ18O from 10 May 2016 to 21 September 2018 in Kathmandu. (b) Seasonal changes in d-excess at Kathmandu from 2016 to 2018. The green, pink, and blue triangles indicate the precipitation d-excess values in 2016, 2017 and 2018, respectively. The horizontal dashed line represents the global average of 10‰.
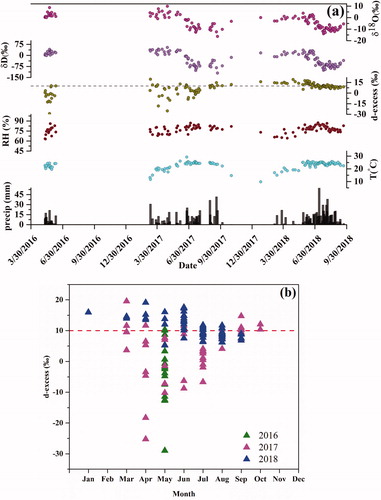
Table 1. Annual variation range of daily averaged δ18O, δD and d-excess (d) during the study period.
Table 2. Summary of precipitation stable isotopes data along with temperature and precipitation amount between earlier study and present study at Kathmandu.
Fig. 5. Relationship between d-excess and δ18O in precipitation events during monsoon and non-monsoon season.
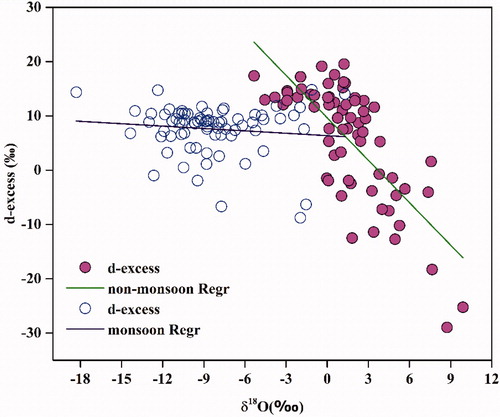
Table 3. Correlations of δ18O and d-excess with temperature (T), precipitation (P), relative humidity (RH), and vapour pressure deficit (VPD) at different timescales. The number in parentheses indicates sample size.
Table 4. Precipitation samples showing high δ18O and δD at the time of relatively high precipitation amount.
Table 5. Values of weighted δ18O, weighted d-excess and δD- δ18O correlation parameters (slope, intercept and R2) for different amount (mm) intervals in precipitation collected at Kathmandu from 10 May 2016 to 21 Sept 2018.
Fig. 7. Specific humidity variations along 5 d backward moisture trajectories calculated at 500 m, 1000 m, and 1500 m above ground level for precipitation events of Kathmandu on (a) 20 May 2016, (b) 23 May 2016, (c) 15 March 2017, (d) 01 April 2017, (e) 23 April 2017, and (f) 29 April 2017. (To distinguish different atmospheric height, see supplemental material, Fig. S1).
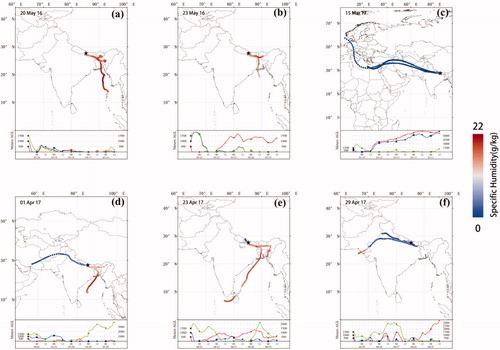
Fig. 8. Five days cluster-mean air parcel backward trajectories for (a) March, (b) April, and (c) May 2017. Dark black lines indicate the elevation higher than 3000 m asl.
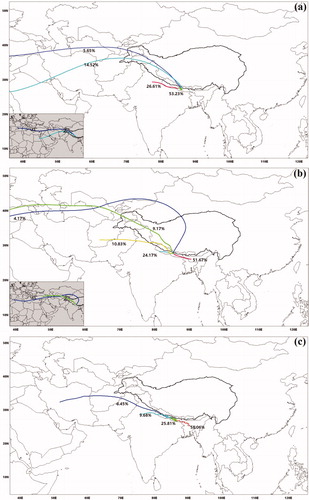
Fig. 9. Hovmöller diagram of OLR averaged over 84°E to 88°E during monsoon season of (a) 2017 and (b) 2018. The colour scale indicates OLR in W/m2. Dash parallel lines depict the latitudinal extends of sampling site.
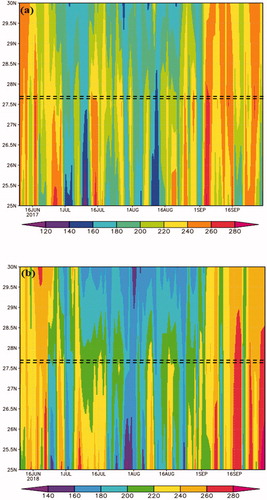
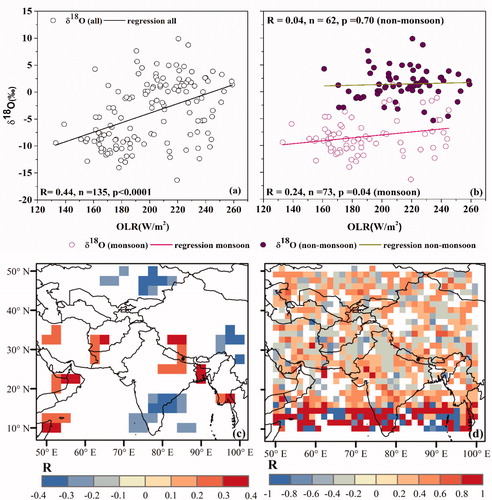
Fig. 10. Relation between δ18O and OLR for (a) overall samples (b) during monsoon and non-monsoon period, (c) spatial correlation between δ18O and OLR, and (d) spatial correlation between δ18O and precipitation amount during monsoon season.