Figures & data
Fig. 1. Location map showing two east–west transects that were sampled across mountain ranges in the Pacific Northwest. The southern transect is at ∼44.6° and crosses Oregon (red circles). The northern transect is at ∼47.8° and crosses Washington (blue circles). Both transects dissect two major mountain ranges, the Coast Range and Cascade Mountains in Oregon and the Olympic and Cascade Mountains in Washington. Moisture is typically brought into the study area by westerlies with significant rainout on the windward (western) flank of the Coast Range, Olympic Mountains, and Cascade Mountains. A substantial rain shadow exists east of the Cascade Mountains. The background digital elevation map (DEM) is from the Shuttle Radar Topography Mission (SRTM).
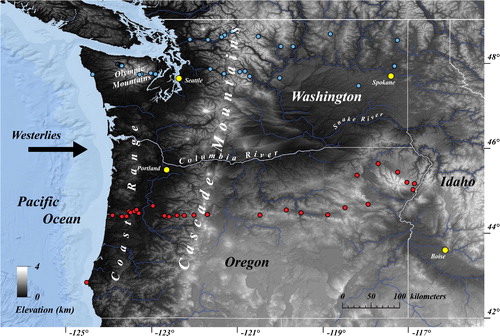
Fig. 2. Plot of climate parameters versus longitude for both the Washington (A) and Oregon (B) transects. For the Olympic Mountains (Washington) and Coast Range (Oregon), precipitation amount increases to the highest elevations. For the Cascades, precipitation amount and relative humidity start to decrease before reaching the range crest. Climate information is derived from the PRISM 30-year normals at 800 m resolution. Relative humidity is estimated from mean annual temperature and mean annual dew point temperature using Eq. (4) in Supplementary Materials. Elevation information is derived from a 200 m resolution digital elevation model (DEM) from the Shuttle Radar Topography Mission (SRTM). Each curve represents the average value along a 100 km swath centered along each transect at (A) 47.8° and (B) 44.5° latitudes.
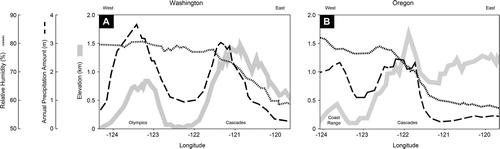
Table 1. Location information, isotopic data, and meteorological parameters for each sample site and associated watershed. δ17O values are shown to 4 decimal places per Schoenemann et al. (Citation2013).
Fig. 3. (A) Plot of δ18O versus δ2H for all samples analyzed in this study. Circles are stream samples and squares are lake samples. Solid symbols are from west of the Cascades Mountains and open symbols are from east of the Cascades. The slope of the Local Meteoric Water Line (LMWL) (solid) is slightly higher than the Global Meteoric Water Line (GMWL) (dashed) at 8.86 versus 8, respectively. Significant evaporation in the rain shadow of the Cascade Mountains (east) lowering d-excess in more distilled (continental) samples is likely the primary cause as the LMWL for Oregon Coast Range and Olympic Mountain samples (not shown) has a slope similar to the GMWL (y = 8.1x + 9.3; R2 = 0.99). (B) Plot of ln(δ18O/1000 + 1) and ln(δ17O/1000 + 1) for all samples analyzed in this study. This is the same sample population shown in (A). The mass-dependent fractionation coefficient (λ) for all samples is 0.5280 ± 0.0005. This is close to the theoretically determined coefficient for equilibrium fractionation of water (λ = 0.529 ± 0.001) (Barkan and Luz, Citation2005) and the same as that observed in meteoric waters (λ = 0.528) (Meijer and Li, Citation1998; Luz and Barkan, Citation2010). Uncertainty in δ18O, δ2H, d-excess, δ17O, and 17O-excess are 0.07‰, 0.42‰, 0.46‰, 0.04‰, and 8 ppm, respectively.
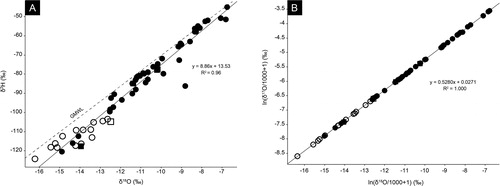
Fig. 4. (A) Plot of δ18O versus δ2H for stream samples in the rain shadow (east) of the Cascade Mountains in Washington (> −119° longitude) and Oregon (> −121° longitude). The slope, m, of the Local Meteoric Water Line (LMWL) is significantly lower than the Global Meteoric Water Line (GMWL) (m = 5.15 versus m = 8), reflecting the influence of evaporation under relatively arid conditions. (B) Plot of ln(δ18O/1000 + 1) and ln(δ17O/1000 + 1) for the same sample population as (A). The slope (λ) is 0.5235, significantly lower than that observed for meteoric water globally (λ = 0.528) (Luz and Barkan, Citation2010). Sample OR641 has been excluded from plots due to anomalously high δ18O, δ17O, and δ2H values. Uncertainty in δ18O and δ2H values are less than 0.07‰ and 0.42‰, respectively.
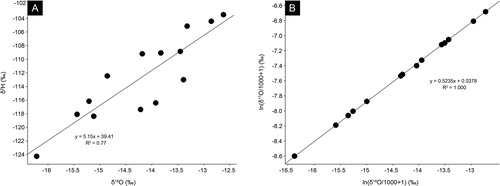
Fig. 5. Plot of δ18O versus elevation for the windward side of the Olympic Mountains (solid circles) and Cascades (solid triangles) in Washington, and the Coast Range (open circles) and Cascades (open triangles) in Oregon. Note that elevation is on the x-axis and δ18O is on the y-axis. A linear regression through these data shows an isotopic lapse rate of −3.2‰/km of elevation gain, similar to the global average of −2.8‰/km (Poage and Chamberlain, Citation2001). Elevation is reported as mean basin hypsometry and is derived from a DEM from the SRTM at ∼200 m resolution.
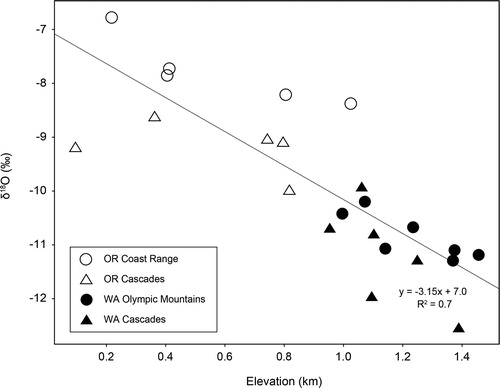
Fig. 6. Plot of d-excess versus elevation for samples from the windward side of the (A) Olympic Mountains (triangles) and (B) Oregon Coast Range (circles). Right-angle arrows show where the cloud base is inferred to intersect with the ground surface, above which there is no subcloud evaporation (relative humidity is 100%). We estimate this is roughly ∼750 m for the Olympics and 500 m for the Oregon Coast Range based on the elevation of maximum precipitation amount (). The open symbols show d-excess values of precipitation at the cloud base estimated from a subcloud evaporation model. Subcloud evaporation explains much of the difference between high and low elevation samples. Linear regressions through each transect have similar slopes suggesting that there is a similar reduction in subcloud evaporation with elevation for both ranges. The difference in y-intercept is likely due to unique moisture provenance for each transect as shown in . Elevation is reported as mean basin hypsometry and is derived from a DEM from the SRTM at ∼200 m resolution. Uncertainty in d-excess values is ±0.46‰.
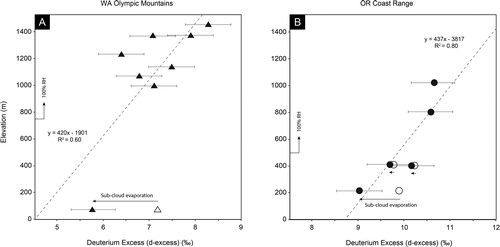
Fig. 7. Plot of 17O-excess versus elevation for samples from the windward side of (A) the Olympic Mountains (triangles) and (B) Oregon Coast Range (circles). Right-angle arrows show where the cloud base is inferred to intersect with the ground surface, above which there is no subcloud evaporation (relative humidity is 100%). This is roughly ∼750 m for the Olympics and 500 m for the Oregon Coast Range based on the elevation of maximum precipitation amount (). The open symbols show 17O-excess values of precipitation at the cloud base estimated from a subcloud evaporation model. Though there is significant scatter, the disparity between low- and high-elevation samples does not appear to be explained by subcloud evaporation alone. Elevation is reported as mean basin hypsometry and is derived from a DEM from the SRTM at ∼200 m resolution. Uncertainty in 17O-excess values is ±8 ppm.
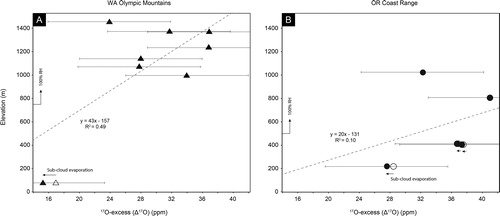
Fig. 8. Plot of d-excess (A) and 17O-excess (B) versus relative humidity (H) for samples from the windward sides of the Coast Range and Cascades. Circles are colored by elevation which is reported as mean basin hypsometry (MBH). Two anomalous samples are not included in this regression. They are DHOW-20 from Ruby Beach, whose PRISM-derived H is anomalously high, likely because it is right next to the ocean, and WA16-1, a shallow, slow moving, and likely highly evaporated stream. Uncertainty in d-excess and 17O-excess values are less than 0.46‰ and 8 ppm, respectively.
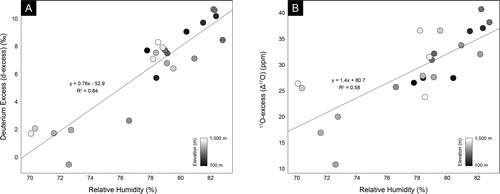
Fig. 9. Surface relative humidity during winter months (Oct–Mar) with an overlay of the difference between air parcel provenance for the Olympic Mountains (blue circle and solid contours) compared to the Oregon Coast Range (red circle and dashed contours). Relatively low d-excess values in Olympic mountain water samples compared to Oregon Coast Range samples for the same elevations () are likely due to comparatively high relative humidity (H) over its source area (∼90% H over SW British Columbia compared to ∼80% H over the Pacific Ocean offshore California). A similar pattern is observed in 17O-excess with relatively low values in the Olympic Mountains relative to the Oregon Coast Range (). Refer to the Supplementary Materials section for details on how this map was created including parameters for HYSPLIT back trajectory analysis. Relative humidity is derived from the NCEP/NCAR reanalysis dataset for years 2015–2016 (Kalnay et al., Citation1996).
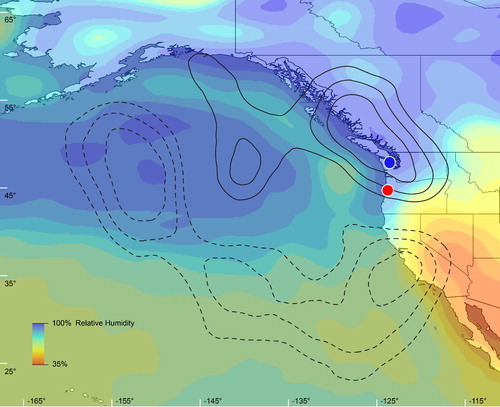
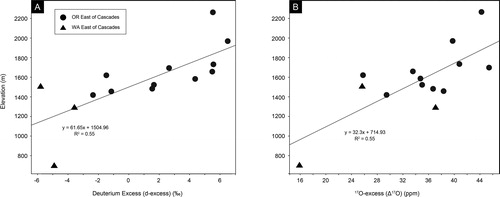
Fig. 10. Plot of (A) d-excess and (B) 17O-excess versus elevation for samples from the leeward (east) side of the Cascade Mountains in Washington (triangles) and Oregon (circles). Eastern population is defined as sample watersheds with a centroid that is > −119° longitude (Washington) and > −121° longitude (Oregon). Elevation is reported as mean basin hypsometry and is derived from a DEM from the SRTM at ∼200 m resolution. Uncertainty in d-excess and 17O-excess values are less than 0.46‰ and 8 ppm respectively.