
Figures & data
Fig. 1. Locations of the 31 selected measurement sites (with at least six months of data available for 2015, see details in ). Blue triangles indicate mountain sites, green diamonds coastal sites and orange circles indicate ‘other’ sites that are not included in the first two categories.
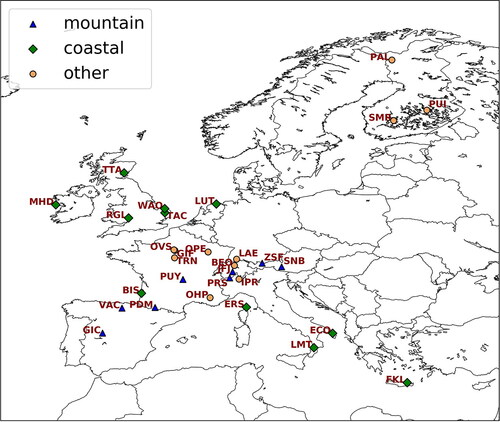
Table 1. Total and sectoral emissions [Tg CH4 year−1] of the TNO-MACC_III, EDGAR v4.3.2 and ECLIPSE V5a anthropogenic inventories in our European domain.
Table 2. Set-ups and input data for the atmospheric chemistry–transport models CHIMERE and LOTOS-EUROS for the simulations in 2015.
Fig. 2. Average (top, in kg m–2 s–1) and standard deviations (SDs, bottom, in kg m−2 s−1) of yearly CH4 emissions from the anthropogenic and natural data sets : total, three main anthropogenic emission sectors and natural wetland emissions (see Section 2.2 for definition).
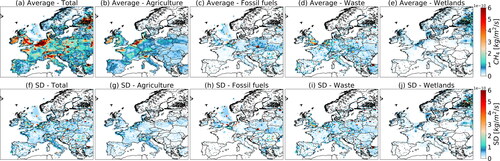
Table 3. Simulations performed with the set-ups of the two chemistry–transport models (CTMs) described in .
Table 4 Standard deviation (SD) relative to the average (%) between the three anthropogenic and natural data sets for selected countries.
Fig. 3. Spatial correlation lengths of the prior errors for the agriculture, waste, fossil fuel (FF) related sectors and wetlands (see Section 2.2 for definition) per grid cell at the horizontal resolution.
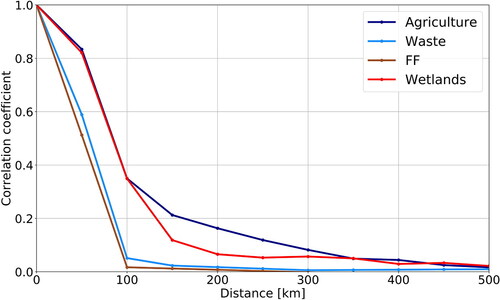
Fig. 4. Correlations (colour matrices): cross-sector correlations over the European domain (left) and cross-sector cross-country correlations for 13 selected countries (right, see for list). White = correlation not significant, green = negative correlation, violet = positive correlation. The matching standard deviations (SD, in % of the average) are given in the top bar charts.
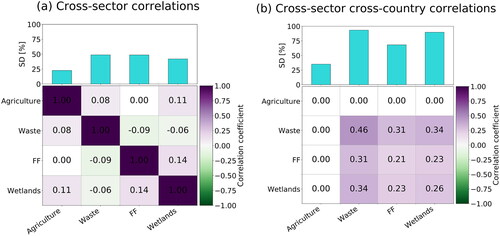
Fig. 5. Anthropogenic CH4 emissions (Tg CH4 year−1) of different source sectors of the TNO-MACC_III (2011), EDGAR v4.3.2 (2011) and ECLIPSE V5a (2010) inventories and their average compared to the anthropogenic emissions of the UNFCCC (2016) for 13 selected countries (see for list). The error bars indicate the uncertainties on the UNFCCC emissions and the uncertainties estimated here on the average inventory emissions. The UNFCCC emissions and corresponding uncertainties of Switzerland could not be assessed due to incomplete information in the NIR.
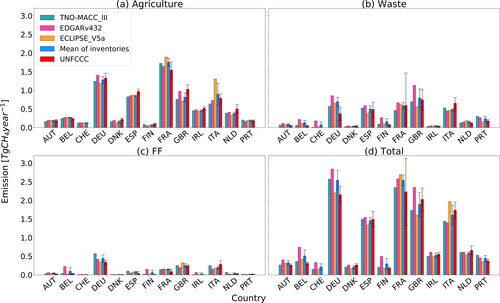
Table 5. Total anthropogenic emissions [Tg CH4 year−1] and associated uncertainties as 1-σ SD [Tg CH4 year−1 and %] from this study compared to top-down (TD) emission estimates and uncertainties from other studies and to the UNFCCC emissions and uncertainties (for country names, see ).

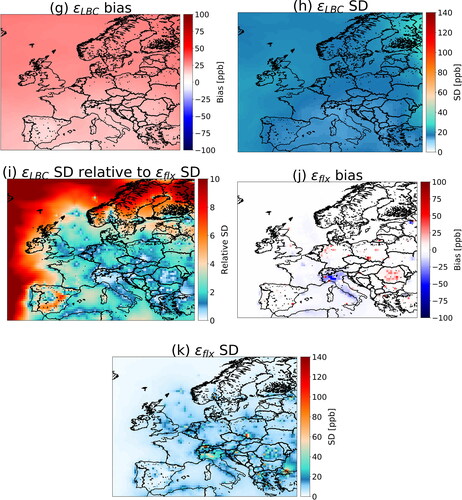
Fig. 7. Standard deviations (SDs) of
and
for 2015 at the 31 selected measurement sites (details in ). The colour and number give the same information.
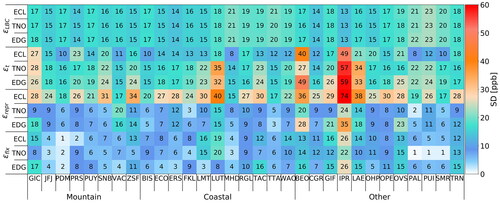
Fig. 8. Characteristic time scales (in days) of the decrease of temporal auto-correlation for
and
over the domain for 2015.
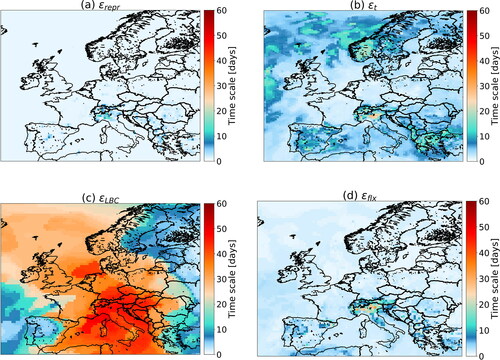
Fig. 9. Characteristic time scales (in days) of the decrease of temporal auto-correlation for
and
with the three inventories at the 31 selected measurement sites (details in ) for 2015.
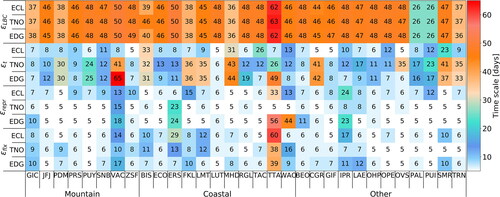
Fig. 10. Spatial correlations over the whole domain for the three estimates of
and
(indicated by the name of the emission inventory used, see Section 3.2 for details) and for the estimate of
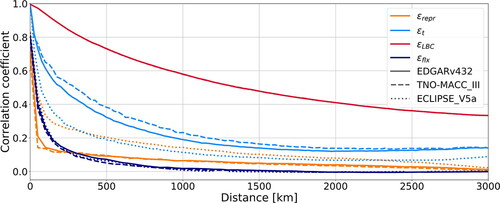
Table 6. Total errors [ppb] in the concentration space at the location of measurement sites (see more information on sites and locations in and in ).
Table 7. Summary of the errors estimated in this study: main recommendations to treat each error in an inversion system for targeting CH4 emissions in Europe at the yearly scale and orders of magnitude of correlation lengths which can be used to simply represent some of them.
Data availability statement
The data that support the findings of this study are available from the corresponding author upon request.