
Figures & data
Figure 1. Path diagrams representing a time varying treatment exposure (At), an outcome variable (Yt) and confounding by a variable (X) that is (a) time invariant; (b) time-varying and not affected by prior treatment; and (c) time-varying and affected by prior treatment.
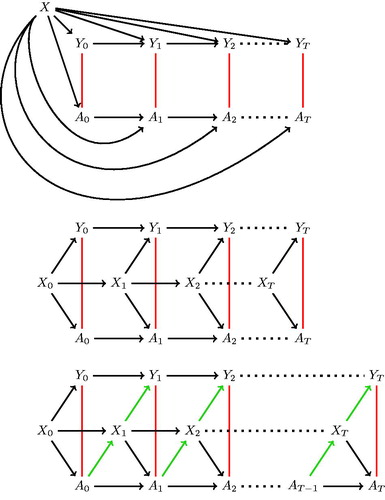
Figure 2. Time-invariant confounding: heat maps of the bias of the estimated treatment effect, on the log odds ratio (ln(OR)) scale, when failing to control for confounding. With varying effect of a confounding variable on being in treatment (βXA) and outcome (βXY). The area in blue represents negative bias, the area in red positive bias.
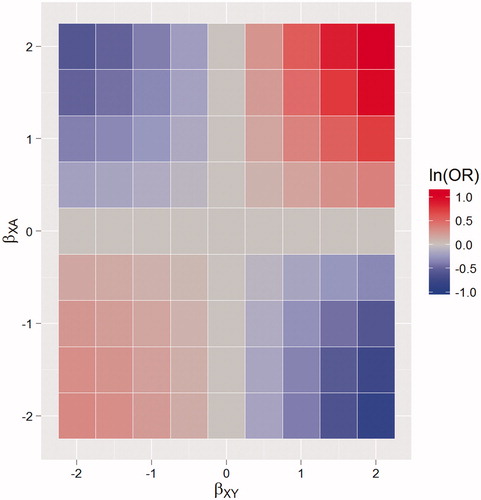
Figure 3. Time-varying confounding: Heat maps of the bias on the log odds ratio (ln(OR)) scale, when (a) there is no adjustment, (b) adjusting for the baseline value of the confounder only. With varying effect of a time-varying, deterministic, confounding variable on being in treatment (βXA) and outcome (βXY). The area in blue represents negative bias, the area in red positive bias.
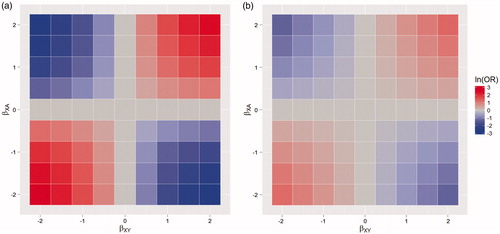
Table 1. Bias on the log odds ratio (ln(OR)) scale from simulations for different effects of a time-varying variable on treatment (βXA) and outcome (βXY) and the effect of prior treatment on that variable (βAXAXE); unadjusted analysis and after adjusting for the time-varying variable.