
Figures & data
Table 1. Descriptions of craving models, as reviewed by Skinner and Aubin (Citation2010). The left column presents the model name and its founding publication as identified by Skinner and Aubin (Citation2010). The central column briefly describes the model, and the right column shows Skinner and Aubin’s (Citation2010) critical appraisal of the various models.
Figure 1. Schematic representation of the extraction of decision criteria. M represents the number of models included or excluded at each step of the procedure.
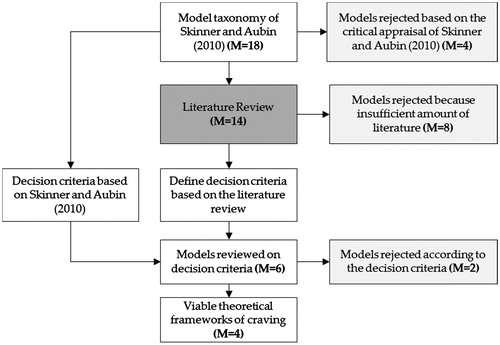
Figure 2. Flowchart of the literature search strategy. N represents the number of articles included of excluded at each step of the procedure.
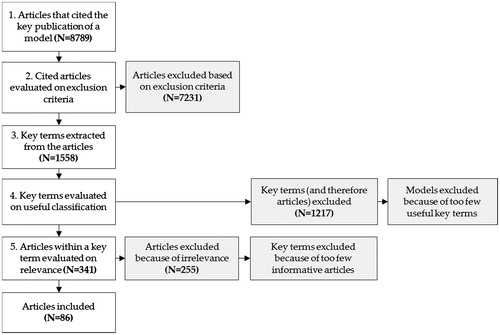
Table 2. Results from snowballing and keyword extraction literature search strategy to identifying craving models. The first column shows the model with its founding publication. The second column shows the number of articles found with snowballing, and the third column shows the number of articles remaining after applying inclusion and exclusion criteria. The overview of key terms, the number of articles found on their basis, and the final number of relevant articles found are presented in the fourth column.
Table 3. Effect of drinking motives on dependence or drinking.
Table 4. Results for each model on the decision criteria in order to determine the most suitable model.
Table 5. Parameter selection from the different models in the theoretical frameworks defined.